Segment Form LineChart : Line Chart « Chart « Flex
- Flex
- Chart
- Line Chart
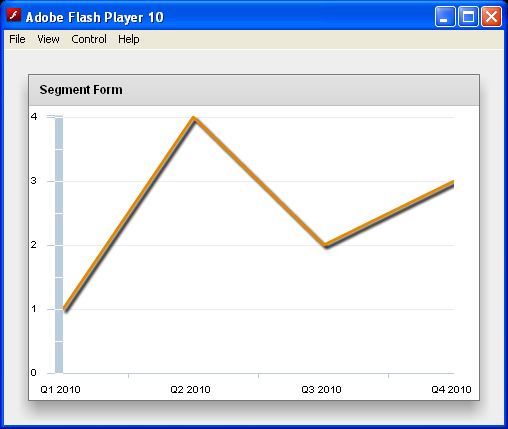
Segment Form LineChart
<?xml version="1.0" encoding="utf-8"?>
<mx:Application xmlns:mx="http://www.adobe.com/2006/mxml"
  backgroundColor="#EEEEEE" layout="horizontal">


  <mx:Model id="trendModel">
<data>
    <row>
      <quarter>Q1 2010</quarter>
      <sales>1</sales>
    </row>
    <row>
      <quarter>Q2 2010</quarter>
      <sales>4</sales>
    </row>
    <row>
      <quarter>Q3 2010</quarter>
      <sales>2</sales>
    </row>
    <row>
      <quarter>Q4 2010</quarter>
      <sales>3</sales>
    </row>
</data>
  </mx:Model>
  <mx:ArrayCollection id="trendData" source="{trendModel.row}"/>

    <mx:Panel title="Segment Form" height="100%" width="100%">
      <mx:LineChart dataProvider="{trendData}"
        height="100%" width="100%">
        <mx:horizontalAxis>
          <mx:CategoryAxis dataProvider="{trendData}" categoryField="quarter"/>
        </mx:horizontalAxis>
        <mx:series>
          <mx:LineSeries xField="quarter" yField="sales" form="segment"/>
        </mx:series>
      </mx:LineChart>
    </mx:Panel>

</mx:Application>
Related examples in the same category