| Home | ||||||||||||||||||||
| Flex | ||||||||||||||||||||
|
| Flex » Chart | Screenshots |
| Image index for Chart : 1 2 3 4 5 6 7 8 9 10 11 12 13 14 15 16 17 18 19 20 21 22 23 24 25 26 27 28 29 30 |
| The following example mixes a LineSeries and a ColumnSeries Click image to read the source code. |
 |
| Use a LinearGradient class with three colors for a gradient fill of the chart's background: Click image to read the source code. |
 |
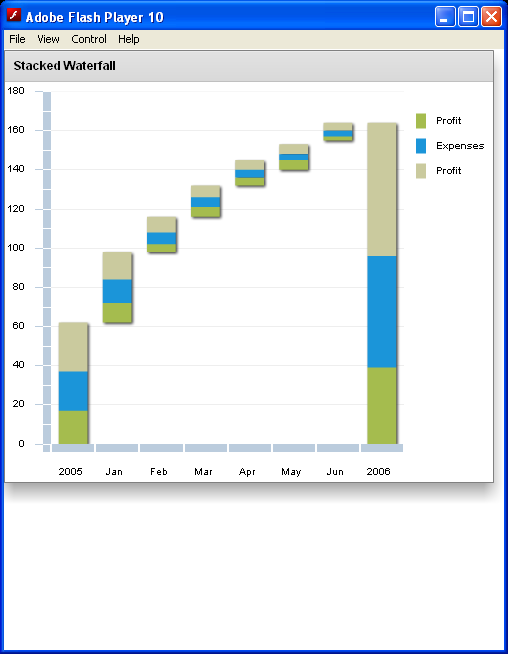
| Waterfall Stacked ColumnChart Click image to read the source code. |
 |
| Define a custom SolidColor object and a custom SolidColorStroke object, and applies them to the BubbleSeries object in the BubbleChart control. Click image to read the source code. |
 |
| logs a ChartEvent when you click or double-click the chart control Click image to read the source code. |
 |
| Creates a floating ColumnChart control Click image to read the source code. |
 |
| Define a custom SolidColor object and a custom SolidColorStroke object, and applies them to the ColumnSeries object in the ColumnChart control. Click image to read the source code. |
 |
| Add or remove a data point from a series in ActionScript. Click image to read the source code. |
 |