| Home | ||||||||||||||||||||
| Flex | ||||||||||||||||||||
|
| Flex » Chart | Screenshots |
| Image index for Chart : 1 2 3 4 5 6 7 8 9 10 11 12 13 14 15 16 17 18 19 20 21 22 23 24 25 26 27 28 29 30 |
| Increments and decrements the series's selectedIndex property to select each item Click image to read the source code. |
 |
| Use these methods to cycle through the data points in a ColumnChart control. Click image to read the source code. |
 |
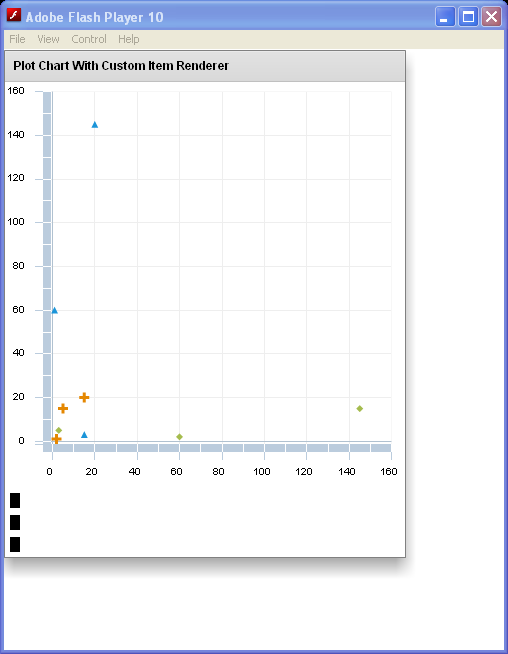
| Set renderer for the second series to the CircleItemRenderer and the renderer for the third series to the CrossItemRenderer in ActionScript. Click image to read the source code. |
 |
| Plot With Custom Renderer Click image to read the source code. |
 |
| Create a PlotChart control and records the location of the mouse pointer Click image to read the source code. |
 |
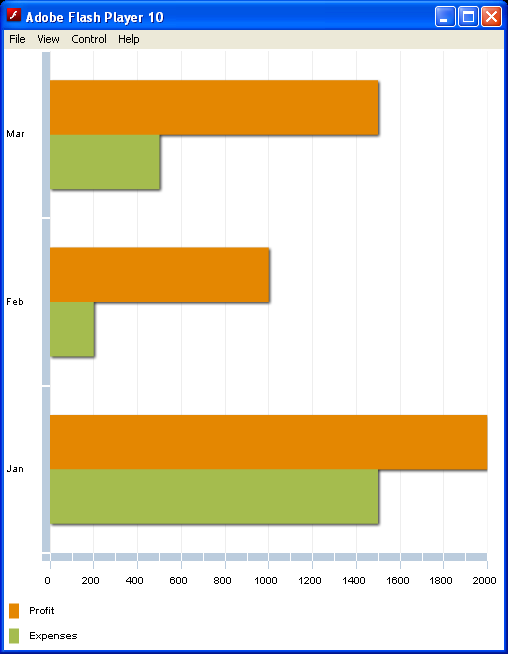
| Basic BarChart Size Click image to read the source code. |
 |
| Stack the Profit and Expenses fields, in which some of the values are negative. Click image to read the source code. |
 |
| Remove Shadows for ColumnChart Click image to read the source code. |
 |