| Home | ||||||||||||||||||||
| Flex | ||||||||||||||||||||
|
| Flex » Chart | Screenshots |
| Image index for Chart : 1 2 3 4 5 6 7 8 9 10 11 12 13 14 15 16 17 18 19 20 21 22 23 24 25 26 27 28 29 30 |
| Chart double click event Click image to read the source code. |
 |
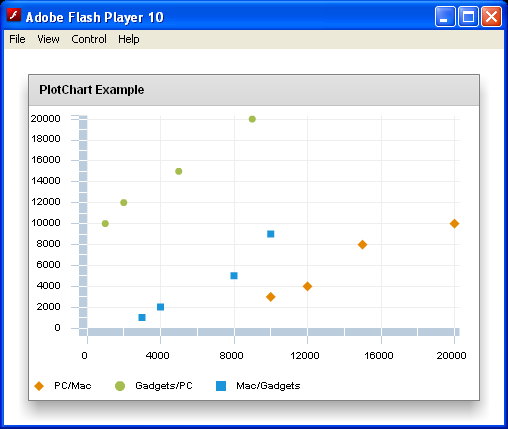
| Plot Chart Demo Click image to read the source code. |
 |
| Chart single Click event Click image to read the source code. |
 |
| Dynamically size Bar chart Click image to read the source code. |
 |
| Add a second |
 |
| defines the colors for two series in the ColumnChart control Click image to read the source code. |
 |
| Set Axis label for Column chart Click image to read the source code. |
 |
| Create a ColumnChart control with two series Click image to read the source code. |
 |