| Home | ||||||||||||||||||||
| Flex | ||||||||||||||||||||
|
| Flex » Chart | Screenshots |
| Image index for Chart : 1 2 3 4 5 6 7 8 9 10 11 12 13 14 15 16 17 18 19 20 21 22 23 24 25 26 27 28 29 30 |
| selectedIndices property lets you select any number of ChartItems in a chart control. Click image to read the source code. |
 |
| Vertical Axis as the data series Click image to read the source code. |
 |
| Create an HLOCChart control Click image to read the source code. |
 |
| Define the weight and color of the strokes, and then applies those strokes to the chart's AxisRenderer class Click image to read the source code. |
 |
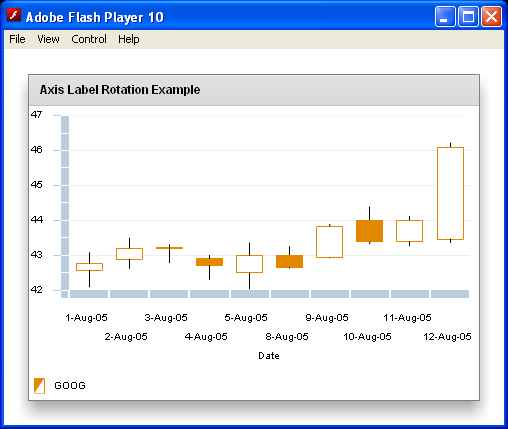
| Candlestick Chart Axis Label Rotation Example Click image to read the source code. |
 |
| Plot chart used to display two series Click image to read the source code. |
 |
| Add a drop shadow filter to a PieChart control, Flex renders that drop shadow filter in addition to the default drop shadow filter on the PieSeries. Click image to read the source code. |
 |
| Basic Area One Series for AreaChart Click image to read the source code. |
 |