| Home | ||||||||||||||||||||
| Flex | ||||||||||||||||||||
|
| Flex » Chart | Screenshots |
| Image index for Chart : 1 2 3 4 5 6 7 8 9 10 11 12 13 14 15 16 17 18 19 20 21 22 23 24 25 26 27 28 29 30 |
| Using SeriesInterpolate Click image to read the source code. |
 |
| Area chart with AreaSeries and CategoryAxis Click image to read the source code. |
 |
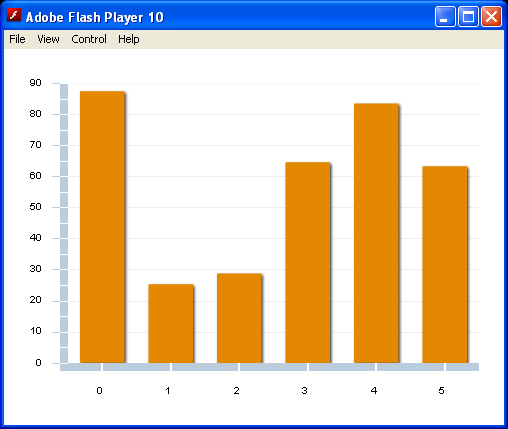
| ColumnChart with ColumnSeries Click image to read the source code. |
 |
| Clearing selections Click image to read the source code. |
 |
| Shows a parsing method that creates a Date object from String values in the data provider that match the 'YYYY, MM, DD' pattern: Click image to read the source code. |
 |
| Setup CandlestickChart Click image to read the source code. |
 |
| Defining AxisRenderer properties with strokes Click image to read the source code. |
 |
| Sets tick marks to the inside of the axis line, sets the tick mark's length to 12 pixels, and hides minor tick marks Click image to read the source code. |