| Home | ||||||||||||||||||||
| Flex | ||||||||||||||||||||
|
| Flex » Chart | Screenshots |
| Image index for Chart : 1 2 3 4 5 6 7 8 9 10 11 12 13 14 15 16 17 18 19 20 21 22 23 24 25 26 27 28 29 30 |
| Creating a custom Legend control Click image to read the source code. |
 |
| Create a custom legend in ActionScript. Click image to read the source code. |
 |
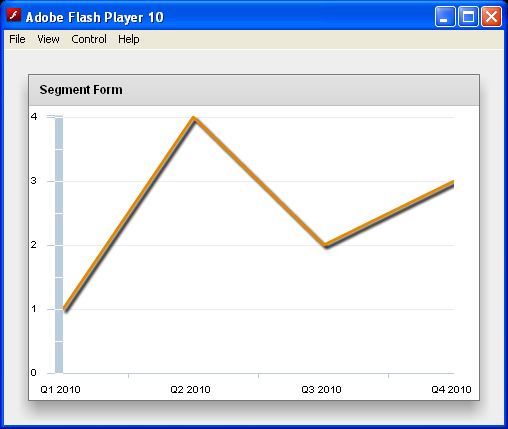
| Segment Form LineChart Click image to read the source code. |
 |
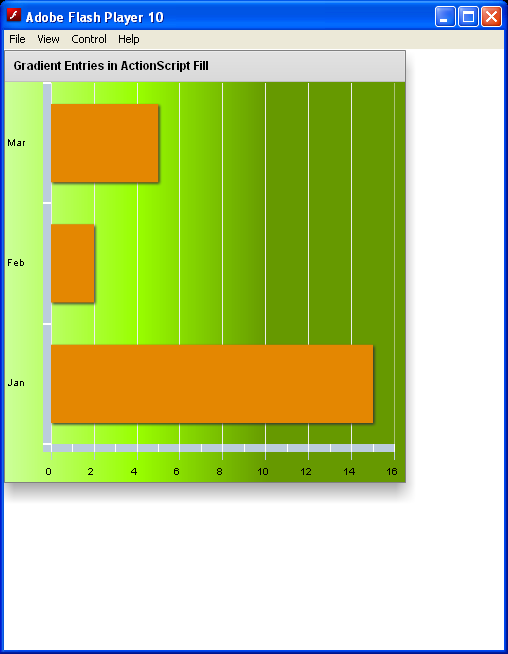
| Gradient Fills In ActionScript Click image to read the source code. |
 |
| uses two series to allow a visual comparison of two stocks that trade in different ranges Click image to read the source code. |
 |
| CSS for LineChart Click image to read the source code. |
 |
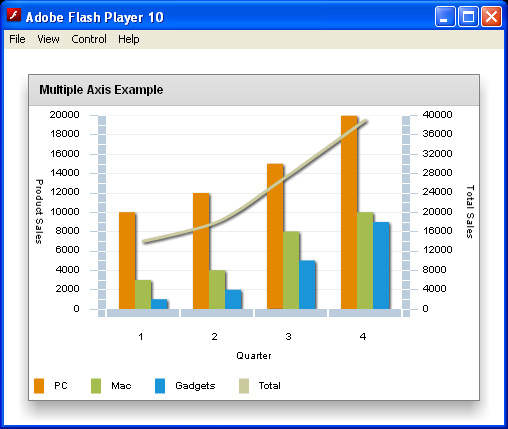
| Multiple Axis Chart Click image to read the source code. |
 |
| Exclude August 13, and then the range of days between August 27 and August 31 Click image to read the source code. |
 |