JFreeChart: Area Chart Demo
/* ===========================================================
* JFreeChart : a free chart library for the Java(tm) platform
* ===========================================================
*
* (C) Copyright 2000-2004, by Object Refinery Limited and Contributors.
*
* Project Info: http://www.jfree.org/jfreechart/index.html
*
* This library is free software; you can redistribute it and/or modify it under the terms
* of the GNU Lesser General Public License as published by the Free Software Foundation;
* either version 2.1 of the License, or (at your option) any later version.
*
* This library is distributed in the hope that it will be useful, but WITHOUT ANY WARRANTY;
* without even the implied warranty of MERCHANTABILITY or FITNESS FOR A PARTICULAR PURPOSE.
* See the GNU Lesser General Public License for more details.
*
* You should have received a copy of the GNU Lesser General Public License along with this
* library; if not, write to the Free Software Foundation, Inc., 59 Temple Place, Suite 330,
* Boston, MA 02111-1307, USA.
*
* [Java is a trademark or registered trademark of Sun Microsystems, Inc.
* in the United States and other countries.]
*
* ------------------
* AreaChartDemo.java
* ------------------
* (C) Copyright 2002-2004, by Object Refinery Limited and Contributors.
*
* Original Author: David Gilbert (for Object Refinery Limited);
* Contributor(s): -;
*
* $Id: AreaChartDemo.java,v 1.34 2004/05/26 13:04:14 mungady Exp $
*
* Changes
* -------
* 11-Jun-2002 : Version 1 (DG);
* 25-Jun-2002 : Removed unnecessary imports (DG);
* 10-Oct-2002 : Renamed AreaChartForCategoryDataDemo --> AreaChartDemo (DG);
* 05-Nov-2003 : Added category label position (DG);
*
*/
package org.jfree.chart.demo;
import java.awt.Color;
import java.awt.Dimension;
import java.awt.Font;
import org.jfree.chart.ChartFactory;
import org.jfree.chart.ChartPanel;
import org.jfree.chart.JFreeChart;
import org.jfree.chart.axis.CategoryAxis;
import org.jfree.chart.axis.CategoryLabelPositions;
import org.jfree.chart.axis.NumberAxis;
import org.jfree.chart.plot.CategoryPlot;
import org.jfree.chart.plot.PlotOrientation;
import org.jfree.chart.title.TextTitle;
import org.jfree.data.category.CategoryDataset;
import org.jfree.data.general.DatasetUtilities;
import org.jfree.ui.ApplicationFrame;
import org.jfree.ui.RectangleEdge;
import org.jfree.ui.RefineryUtilities;
import org.jfree.ui.Spacer;
import org.jfree.ui.VerticalAlignment;
import org.jfree.util.Log;
import org.jfree.util.PrintStreamLogTarget;
/**
* A simple demonstration application showing how to create an area chart using data from a
* {@link CategoryDataset}.
*/
public class AreaChartDemo extends ApplicationFrame {
/**
* Creates a new demo application.
*
* @param title the frame title.
*/
public AreaChartDemo(final String title) {
super(title);
// create a dataset...
final double[][] data = new double[][] {
{1.0, 4.0, 3.0, 5.0, 5.0, 7.0, 7.0, 8.0},
{5.0, 7.0, 6.0, 8.0, 4.0, 4.0, 2.0, 1.0},
{4.0, 3.0, 2.0, 3.0, 6.0, 3.0, 4.0, 3.0}
};
final CategoryDataset dataset = DatasetUtilities.createCategoryDataset(
"Series ", "Type ", data
);
// create the chart...
final JFreeChart chart = createChart(dataset);
final ChartPanel chartPanel = new ChartPanel(chart);
chartPanel.setPreferredSize(new Dimension(500, 270));
chartPanel.setEnforceFileExtensions(false);
setContentPane(chartPanel);
}
// ****************************************************************************
// * JFREECHART DEVELOPER GUIDE *
// * The JFreeChart Developer Guide, written by David Gilbert, is available *
// * to purchase from Object Refinery Limited: *
// * *
// * http://www.object-refinery.com/jfreechart/guide.html *
// * *
// * Sales are used to provide funding for the JFreeChart project - please *
// * support us so that we can continue developing free software. *
// ****************************************************************************
/**
* Creates a chart.
*
* @param dataset the dataset.
*
* @return The chart.
*/
private JFreeChart createChart(final CategoryDataset dataset) {
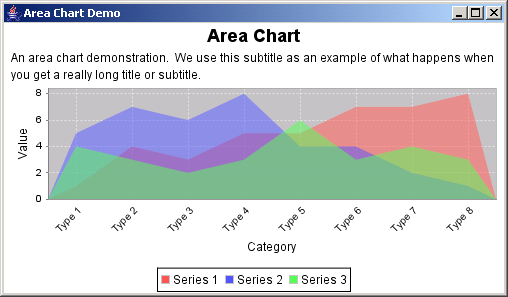
final JFreeChart chart = ChartFactory.createAreaChart(
"Area Chart", // chart title
"Category", // domain axis label
"Value", // range axis label
dataset, // data
PlotOrientation.VERTICAL, // orientation
true, // include legend
true, // tooltips
false // urls
);
// NOW DO SOME OPTIONAL CUSTOMISATION OF THE CHART...
// set the background color for the chart...
// final StandardLegend legend = (StandardLegend) chart.getLegend();
// legend.setAnchor(StandardLegend.SOUTH);
chart.setBackgroundPaint(Color.white);
final TextTitle subtitle = new TextTitle("An area chart demonstration. We use this "
+ "subtitle as an example of what happens when you get a really long title or "
+ "subtitle.");
subtitle.setFont(new Font("SansSerif", Font.PLAIN, 12));
subtitle.setPosition(RectangleEdge.TOP);
// subtitle.setSpacer(new Spacer(Spacer.RELATIVE, 0.05, 0.05, 0.05, 0.05));
subtitle.setVerticalAlignment(VerticalAlignment.BOTTOM);
chart.addSubtitle(subtitle);
final CategoryPlot plot = chart.getCategoryPlot();
plot.setForegroundAlpha(0.5f);
// plot.setAxisOffset(new Spacer(Spacer.ABSOLUTE, 5.0, 5.0, 5.0, 5.0));
plot.setBackgroundPaint(Color.lightGray);
plot.setDomainGridlinesVisible(true);
plot.setDomainGridlinePaint(Color.white);
plot.setRangeGridlinesVisible(true);
plot.setRangeGridlinePaint(Color.white);
final CategoryAxis domainAxis = plot.getDomainAxis();
domainAxis.setCategoryLabelPositions(CategoryLabelPositions.UP_45);
domainAxis.setLowerMargin(0.0);
domainAxis.setUpperMargin(0.0);
domainAxis.addCategoryLabelToolTip("Type 1", "The first type.");
domainAxis.addCategoryLabelToolTip("Type 2", "The second type.");
domainAxis.addCategoryLabelToolTip("Type 3", "The third type.");
final NumberAxis rangeAxis = (NumberAxis) plot.getRangeAxis();
rangeAxis.setStandardTickUnits(NumberAxis.createIntegerTickUnits());
rangeAxis.setLabelAngle(0 * Math.PI / 2.0);
// OPTIONAL CUSTOMISATION COMPLETED.
return chart;
}
/**
* Starting point for the demonstration application.
*
* @param args ignored.
*/
public static void main(final String[] args) {
Log.getInstance().addTarget(new PrintStreamLogTarget());
final AreaChartDemo demo = new AreaChartDemo("Area Chart Demo");
demo.pack();
RefineryUtilities.centerFrameOnScreen(demo);
demo.setVisible(true);
}
}
 jfreechart-1.0.0-rc1.zip( 3,559 k)
Related examples in the same category