JFreeChart: Dual Axis Demo 3
/* ===========================================================
* JFreeChart : a free chart library for the Java(tm) platform
* ===========================================================
*
* (C) Copyright 2000-2004, by Object Refinery Limited and Contributors.
*
* Project Info: http://www.jfree.org/jfreechart/index.html
*
* This library is free software; you can redistribute it and/or modify it under the terms
* of the GNU Lesser General Public License as published by the Free Software Foundation;
* either version 2.1 of the License, or (at your option) any later version.
*
* This library is distributed in the hope that it will be useful, but WITHOUT ANY WARRANTY;
* without even the implied warranty of MERCHANTABILITY or FITNESS FOR A PARTICULAR PURPOSE.
* See the GNU Lesser General Public License for more details.
*
* You should have received a copy of the GNU Lesser General Public License along with this
* library; if not, write to the Free Software Foundation, Inc., 59 Temple Place, Suite 330,
* Boston, MA 02111-1307, USA.
*
* [Java is a trademark or registered trademark of Sun Microsystems, Inc.
* in the United States and other countries.]
*
* ------------------
* DualAxisDemo3.java
* ------------------
* (C) Copyright 2002-2004, by Object Refinery Limited and Contributors.
*
* Original Author: David Gilbert (for Object Refinery Limited);
* Contributor(s): -;
*
* $Id: DualAxisDemo3.java,v 1.19 2004/04/29 07:54:56 mungady Exp $
*
* Changes
* -------
* 19-Nov-2002 : Version 1 (DG);
*
*/
package org.jfree.chart.demo;
import java.awt.Color;
import org.jfree.chart.ChartFactory;
import org.jfree.chart.ChartPanel;
import org.jfree.chart.JFreeChart;
import org.jfree.chart.axis.AxisLocation;
import org.jfree.chart.axis.NumberAxis;
import org.jfree.chart.axis.ValueAxis;
import org.jfree.chart.plot.CategoryPlot;
import org.jfree.chart.plot.PlotOrientation;
import org.jfree.chart.renderer.category.CategoryItemRenderer;
import org.jfree.chart.renderer.category.LineAndShapeRenderer;
import org.jfree.data.category.CategoryDataset;
import org.jfree.data.category.DefaultCategoryDataset;
import org.jfree.ui.ApplicationFrame;
import org.jfree.ui.RefineryUtilities;
/**
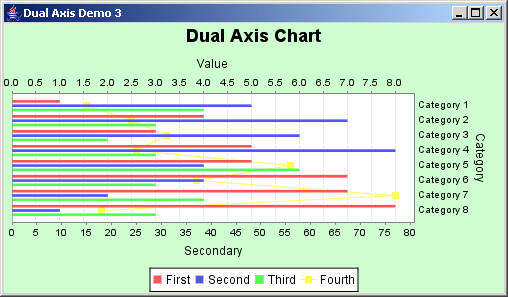
* A simple demonstration application showing how to create a dual axis chart based on data
* from two {@link CategoryDataset} instances.
*
*/
public class DualAxisDemo3 extends ApplicationFrame {
/**
* Creates a new demo instance.
*
* @param title the frame title.
*/
public DualAxisDemo3(final String title) {
super(title);
final CategoryDataset dataset1 = createDataset1();
// create the chart...
final JFreeChart chart = ChartFactory.createBarChart(
"Dual Axis Chart", // chart title
"Category", // domain axis label
"Value", // range axis label
dataset1, // dataset
PlotOrientation.HORIZONTAL, // orientation
true, // include legend
true,
false
);
// NOW DO SOME OPTIONAL CUSTOMISATION OF THE CHART...
// set the background color for the chart...
chart.setBackgroundPaint(new Color(0xCC, 0xFF, 0xCC));
// chart.getLegend().setAnchor(Legend.WEST);
// get a reference to the plot for further customisation...
final CategoryPlot plot = chart.getCategoryPlot();
plot.setDomainAxisLocation(AxisLocation.BOTTOM_OR_RIGHT);
// plot.getDomainAxis().setMaxCategoryLabelWidthRatio(10.0f);
final CategoryDataset dataset2 = createDataset2();
final ValueAxis axis2 = new NumberAxis("Secondary");
plot.setRangeAxis(1, axis2);
plot.setDataset(1, dataset2);
plot.mapDatasetToRangeAxis(1, 1);
plot.setRangeAxisLocation(1, AxisLocation.BOTTOM_OR_RIGHT);
final CategoryItemRenderer renderer2 = new LineAndShapeRenderer();
plot.setRenderer(1, renderer2);
// OPTIONAL CUSTOMISATION COMPLETED.
// add the chart to a panel...
final ChartPanel chartPanel = new ChartPanel(chart);
chartPanel.setPreferredSize(new java.awt.Dimension(500, 270));
setContentPane(chartPanel);
}
/**
* Creates a sample dataset.
*
* @return The dataset.
*/
private CategoryDataset createDataset1() {
// row keys...
final String series1 = "First";
final String series2 = "Second";
final String series3 = "Third";
// column keys...
final String category1 = "Category 1";
final String category2 = "Category 2";
final String category3 = "Category 3";
final String category4 = "Category 4";
final String category5 = "Category 5";
final String category6 = "Category 6";
final String category7 = "Category 7";
final String category8 = "Category 8";
// create the dataset...
final DefaultCategoryDataset dataset = new DefaultCategoryDataset();
dataset.addValue(1.0, series1, category1);
dataset.addValue(4.0, series1, category2);
dataset.addValue(3.0, series1, category3);
dataset.addValue(5.0, series1, category4);
dataset.addValue(5.0, series1, category5);
dataset.addValue(7.0, series1, category6);
dataset.addValue(7.0, series1, category7);
dataset.addValue(8.0, series1, category8);
dataset.addValue(5.0, series2, category1);
dataset.addValue(7.0, series2, category2);
dataset.addValue(6.0, series2, category3);
dataset.addValue(8.0, series2, category4);
dataset.addValue(4.0, series2, category5);
dataset.addValue(4.0, series2, category6);
dataset.addValue(2.0, series2, category7);
dataset.addValue(1.0, series2, category8);
dataset.addValue(4.0, series3, category1);
dataset.addValue(3.0, series3, category2);
dataset.addValue(2.0, series3, category3);
dataset.addValue(3.0, series3, category4);
dataset.addValue(6.0, series3, category5);
dataset.addValue(3.0, series3, category6);
dataset.addValue(4.0, series3, category7);
dataset.addValue(3.0, series3, category8);
return dataset;
}
/**
* Creates a sample dataset.
*
* @return The dataset.
*/
private CategoryDataset createDataset2() {
// row keys...
final String series1 = "Fourth";
// column keys...
final String category1 = "Category 1";
final String category2 = "Category 2";
final String category3 = "Category 3";
final String category4 = "Category 4";
final String category5 = "Category 5";
final String category6 = "Category 6";
final String category7 = "Category 7";
final String category8 = "Category 8";
// create the dataset...
final DefaultCategoryDataset dataset = new DefaultCategoryDataset();
dataset.addValue(15.0, series1, category1);
dataset.addValue(24.0, series1, category2);
dataset.addValue(31.0, series1, category3);
dataset.addValue(25.0, series1, category4);
dataset.addValue(56.0, series1, category5);
dataset.addValue(37.0, series1, category6);
dataset.addValue(77.0, series1, category7);
dataset.addValue(18.0, series1, category8);
return dataset;
}
// ****************************************************************************
// * JFREECHART DEVELOPER GUIDE *
// * The JFreeChart Developer Guide, written by David Gilbert, is available *
// * to purchase from Object Refinery Limited: *
// * *
// * http://www.object-refinery.com/jfreechart/guide.html *
// * *
// * Sales are used to provide funding for the JFreeChart project - please *
// * support us so that we can continue developing free software. *
// ****************************************************************************
/**
* Starting point for the demonstration application.
*
* @param args ignored.
*/
public static void main(final String[] args) {
final DualAxisDemo3 demo = new DualAxisDemo3("Dual Axis Demo 3");
demo.pack();
RefineryUtilities.centerFrameOnScreen(demo);
demo.setVisible(true);
}
}
 jfreechart-1.0.0-rc1.zip( 3,559 k)
Related examples in the same category