JFreeChart: Horizontal Bar Chart 3D Demo 2
/* ===========================================================
* JFreeChart : a free chart library for the Java(tm) platform
* ===========================================================
*
* (C) Copyright 2000-2004, by Object Refinery Limited and Contributors.
*
* Project Info: http://www.jfree.org/jfreechart/index.html
*
* This library is free software; you can redistribute it and/or modify it under the terms
* of the GNU Lesser General Public License as published by the Free Software Foundation;
* either version 2.1 of the License, or (at your option) any later version.
*
* This library is distributed in the hope that it will be useful, but WITHOUT ANY WARRANTY;
* without even the implied warranty of MERCHANTABILITY or FITNESS FOR A PARTICULAR PURPOSE.
* See the GNU Lesser General Public License for more details.
*
* You should have received a copy of the GNU Lesser General Public License along with this
* library; if not, write to the Free Software Foundation, Inc., 59 Temple Place, Suite 330,
* Boston, MA 02111-1307, USA.
*
* [Java is a trademark or registered trademark of Sun Microsystems, Inc.
* in the United States and other countries.]
*
* --------------------
* BarChart3DDemo2.java
* --------------------
* (C) Copyright 2002-2004, by Object Refinery Limited and Contributors.
*
* Original Author: David Gilbert (for Object Refinery Limited);
* Contributor(s): -;
*
* $Id: BarChart3DDemo2.java,v 1.20 2004/04/26 19:11:53 taqua Exp $
*
* Changes
* -------
* 29-May-2002 : Version 1 (DG);
* 10-Oct-2002 : Fixed errors reported by Checkstyle (DG);
* 05-Nov-2002 : Renamed HorizontalBarChart3DDemo.java (DG);
* 13-May-2003 : Renamed BarChart3DDemo2.java (DG);
*
*/
package org.jfree.chart.demo;
import org.jfree.chart.ChartFactory;
import org.jfree.chart.ChartPanel;
import org.jfree.chart.JFreeChart;
import org.jfree.chart.axis.CategoryAxis;
import org.jfree.chart.axis.CategoryLabelPosition;
import org.jfree.chart.axis.CategoryLabelPositions;
import org.jfree.chart.axis.CategoryLabelWidthType;
import org.jfree.chart.plot.CategoryPlot;
import org.jfree.chart.plot.PlotOrientation;
import org.jfree.data.category.CategoryDataset;
import org.jfree.data.category.DefaultCategoryDataset;
import org.jfree.text.TextBlockAnchor;
import org.jfree.ui.ApplicationFrame;
import org.jfree.ui.RectangleAnchor;
import org.jfree.ui.RefineryUtilities;
import org.jfree.ui.TextAnchor;
import org.jfree.util.Log;
import org.jfree.util.PrintStreamLogTarget;
/**
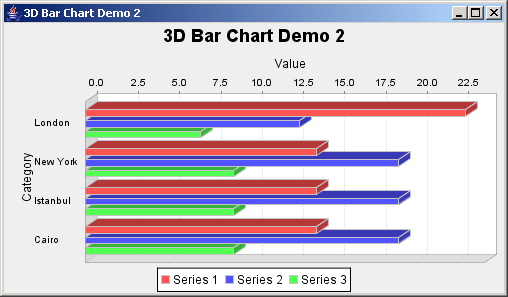
* A simple demonstration application showing how to create a horizontal 3D bar chart using data
* from a {@link CategoryDataset}.
*
*/
public class BarChart3DDemo2 extends ApplicationFrame {
// ****************************************************************************
// * JFREECHART DEVELOPER GUIDE *
// * The JFreeChart Developer Guide, written by David Gilbert, is available *
// * to purchase from Object Refinery Limited: *
// * *
// * http://www.object-refinery.com/jfreechart/guide.html *
// * *
// * Sales are used to provide funding for the JFreeChart project - please *
// * support us so that we can continue developing free software. *
// ****************************************************************************
/**
* Creates a new demo.
*
* @param title the frame title.
*/
public BarChart3DDemo2(final String title) {
super(title);
// create the chart...
final DefaultCategoryDataset dataset = new DefaultCategoryDataset();
dataset.addValue(23.0, "Series 1", "London");
dataset.addValue(14.0, "Series 1", "New York");
dataset.addValue(14.0, "Series 1", "Istanbul");
dataset.addValue(14.0, "Series 1", "Cairo");
dataset.addValue(13.0, "Series 2", "London");
dataset.addValue(19.0, "Series 2", "New York");
dataset.addValue(19.0, "Series 2", "Istanbul");
dataset.addValue(19.0, "Series 2", "Cairo");
dataset.addValue(7.0, "Series 3", "London");
dataset.addValue(9.0, "Series 3", "New York");
dataset.addValue(9.0, "Series 3", "Istanbul");
dataset.addValue(9.0, "Series 3", "Cairo");
final JFreeChart chart = createChart(dataset);
// add the chart to a panel...
final ChartPanel chartPanel = new ChartPanel(chart);
chartPanel.setPreferredSize(new java.awt.Dimension(500, 270));
setContentPane(chartPanel);
}
/**
* Creates a chart.
*
* @param dataset the dataset.
*
* @return The chart.
*/
private JFreeChart createChart(final CategoryDataset dataset) {
final JFreeChart chart = ChartFactory.createBarChart3D(
"3D Bar Chart Demo 2", // chart title
"Category", // domain axis label
"Value", // range axis label
dataset, // data
PlotOrientation.HORIZONTAL, // orientation
true, // include legend
true, // tooltips
false // urls
);
final CategoryPlot plot = chart.getCategoryPlot();
plot.setForegroundAlpha(1.0f);
// left align the category labels...
final CategoryAxis axis = plot.getDomainAxis();
final CategoryLabelPositions p = axis.getCategoryLabelPositions();
final CategoryLabelPosition left = new CategoryLabelPosition(
RectangleAnchor.LEFT, TextBlockAnchor.CENTER_LEFT,
TextAnchor.CENTER_LEFT, 0.0,
CategoryLabelWidthType.RANGE, 0.30f
);
axis.setCategoryLabelPositions(CategoryLabelPositions.replaceLeftPosition(p, left));
return chart;
}
/**
* Starting point for the demonstration application.
*
* @param args ignored.
*/
public static void main(final String[] args) {
Log.getInstance().addTarget(new PrintStreamLogTarget());
final BarChart3DDemo2 demo = new BarChart3DDemo2("3D Bar Chart Demo 2");
demo.pack();
RefineryUtilities.centerFrameOnScreen(demo);
demo.setVisible(true);
}
}
 jfreechart-1.0.0-rc1.zip( 3,559 k)
Related examples in the same category