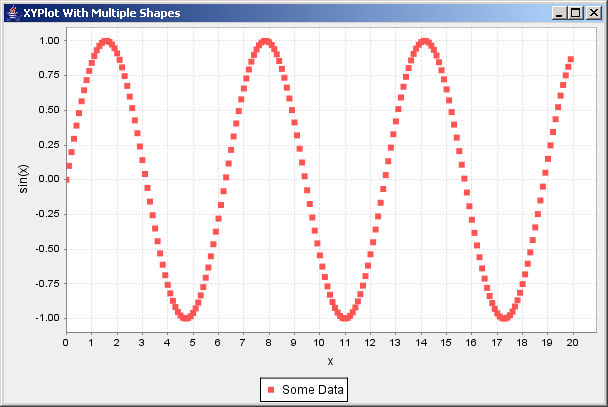
JFreeChart: Multi Shapes XY Demo
/* ===========================================================
 * JFreeChart : a free chart library for the Java(tm) platform
 * ===========================================================
 *
 * (C) Copyright 2000-2004, by Object Refinery Limited and Contributors.
 *
 * Project Info:  http://www.jfree.org/jfreechart/index.html
 *
 * This library is free software; you can redistribute it and/or modify it under the terms
 * of the GNU Lesser General Public License as published by the Free Software Foundation;
 * either version 2.1 of the License, or (at your option) any later version.
 *
 * This library is distributed in the hope that it will be useful, but WITHOUT ANY WARRANTY;
 * without even the implied warranty of MERCHANTABILITY or FITNESS FOR A PARTICULAR PURPOSE.
 * See the GNU Lesser General Public License for more details.
 *
 * You should have received a copy of the GNU Lesser General Public License along with this
 * library; if not, write to the Free Software Foundation, Inc., 59 Temple Place, Suite 330,
 * Boston, MA 02111-1307, USA.
 *
 * [Java is a trademark or registered trademark of Sun Microsystems, Inc.
 * in the United States and other countries.]
 *
 * ----------------------
 * MultiShapesXYDemo.java
 * ----------------------
 * (C) Copyright 2002-2004, by Andreas Schneider.
 *
 * Original Author:  Andreas Schneider;
 * Contributor(s):   -;
 *
 * $Id: MultiShapesXYDemo.java,v 1.12 2004/04/29 08:21:42 mungady Exp $
 *
 * Changes
 * -------
 * 13-May-2002 : Version 1, contributed by Andreas Schneider (DG);
 * 30-May-2002 : Added title to application frame (DG);
 * 11-Oct-2002 : Fixed errors reported by Checkstyle (DG);
 *
 */

package org.jfree.chart.demo;

import java.awt.Color;
import java.awt.Image;
import java.awt.MediaTracker;
import java.awt.Paint;
import java.awt.Point;
import java.awt.Shape;
import java.awt.geom.Ellipse2D;
import java.awt.geom.Rectangle2D;
import java.net.URL;

import org.jfree.chart.ChartPanel;
import org.jfree.chart.JFreeChart;
import org.jfree.chart.axis.NumberAxis;
import org.jfree.chart.plot.Plot;
import org.jfree.chart.plot.XYPlot;
import org.jfree.chart.renderer.xy.StandardXYItemRenderer;
import org.jfree.data.xy.XYSeries;
import org.jfree.data.xy.XYSeriesCollection;
import org.jfree.ui.ApplicationFrame;
import org.jfree.ui.RefineryUtilities;

/**
 * A demonstration showing multiple shapes on an {@link XYPlot}.
 *
 * @author Andreas Schneider
 */
public class MultiShapesXYDemo extends ApplicationFrame {

    /** The number of point. */
    private static final int NUMBER_OF_POINTS = 200;

    /** The increment. */
    private static final double INCREMENT = 0.1;

    /** Color component. */
    private static final float R1 = 0.0f;

    /** Color component. */
    private static final float G1 = 1.0f;

    /** Color component. */
    private static final float B1 = 0.0f;

    /** Color component. */
    private static final float R2 = 1.0f;

    /** Color component. */
    private static final float G2 = 0.0f;

    /** Color component. */
    private static final float B2 = 0.0f;

    /** The series. */
    private XYSeries series;

    /** The ball image. */
    private Image ballImage;

    /** The arrow image. */
    private Image arrowImage;

    /**
     * A demonstration application showing a series with different shape attributes per item.
     *
     * @param title  the frame title.
     */
    public MultiShapesXYDemo(final String title) {

        super(title);

        System.out.println("About to get images...");
        final URL url1 = getClass().getClassLoader().getResource(
            "org/jfree/chart/demo/redball.png"
        );
        final URL url2 = getClass().getClassLoader().getResource("org/jfree/chart/demo/arrow.png");
        if (url1 != null && url2 != null) {
            this.ballImage = new javax.swing.ImageIcon(url1).getImage();
            this.arrowImage = new javax.swing.ImageIcon(url2).getImage();
            final MediaTracker tracker = new MediaTracker(this);
            tracker.addImage(this.ballImage, 0);
            tracker.addImage(this.arrowImage, 1);
            try {
                tracker.waitForID(0);
                tracker.waitForID(1);
            }
            catch (InterruptedException e) {
                e.printStackTrace();
            }
            System.out.println("Images loaded");
        }
        else {
            System.err.println("Can't find images");
        }
        System.out.println("Images done.");
        this.series = new XYSeries("Some Data");
        for (int i = 0; i < NUMBER_OF_POINTS; i++) {
            final double x = INCREMENT * i;
            final double y = Math.sin(x);
            this.series.add(x, y);
        }
        final XYSeriesCollection data = new XYSeriesCollection(this.series);
        final NumberAxis domainAxis = new NumberAxis("x");
        final NumberAxis rangeAxis = new NumberAxis("sin(x)");
        final DemoRenderer renderer = new DemoRenderer();
        final Plot plot = new XYPlot(data, domainAxis, rangeAxis, renderer);
        final JFreeChart chart = new JFreeChart(plot);
        final ChartPanel chartPanel = new ChartPanel(chart);
        chartPanel.setPreferredSize(new java.awt.Dimension(600, 380));
        setContentPane(chartPanel);

    }

    /**
     * A demo renderer.
     *
     * @author AS
     */
    class DemoRenderer extends StandardXYItemRenderer {

        /**
         * Creates a new renderer.
         */
        public DemoRenderer() {
            super(StandardXYItemRenderer.SHAPES | StandardXYItemRenderer.IMAGES, null);
        }

        /**
         * Returns true if the shape is filled, and false otherwise.
         *
         * @param plot  the plot.
         * @param series  the series.
         * @param item  the item.
         * @param x  the x-value.
         * @param y  the y-value.
         *
         * @return true if the shape is filled, and false otherwise.
         */
        protected boolean isShapeFilled(final Plot plot, final int series, final int item,
                                        final double x, final double y) {
            return (item % 2 == 0);
        }

        /**
         * Returns the shape scale.
         *
         * @param plot  the plot.
         * @param series  the series.
         * @param item  the item.
         * @param x  the x-value.
         * @param y  the y-value.
         *
         * @return the shape scale.
         */
        protected double getShapeScale(final Plot plot, final int series, final int item,
                                       final double x, final double y) {
            final float rat = (float) item / (float) NUMBER_OF_POINTS; // 0..1
            return 6.0f - rat * 4.0;
        }

        /**
         * Returns the shape paint.
         *
         * @param plot  the plot.
         * @param series  the series.
         * @param item  the item.
         * @param x  the x-value.
         * @param y  the y-value.
         *
         * @return the shape paint.
         */
        protected Paint getPaint(final Plot plot, final int series, final int item,
                                 final double x, final double y) {
            final float rat = (float) item / (float) NUMBER_OF_POINTS; // 0..1
            final float r = (1.0f - rat) * R1 + rat * R2;
            final float g = (1.0f - rat) * G1 + rat * G2;
            final float b = (1.0f - rat) * B1 + rat * B2;
            final Color c = new Color(r, g, b);
            return c;
        }

        /**
         * Returns the shape.
         *
         * @param plot  the plot.
         * @param series  the series.
         * @param item  the item.
         * @param x  the x-value.
         * @param y  the y-value.
         * @param scale  the scale.
         *
         * @return the shape.
         */
        protected Shape getShape(final Plot plot, final int series, final int item,
                                 final double x, final double y, final double scale) {
            final Shape shape;
            switch (item % 2) {
              case 0:
                shape = new Rectangle2D.Double(x - 0.5 * scale, y - 0.5 * scale, scale, scale);
                break;
              default:
                shape = new Ellipse2D.Double(x - 0.5 * scale, y - 0.5 * scale, scale, scale);
                break;
            }
            return shape;
        }

        /**
         * Returns the image.
         *
         * @param plot  the plot.
         * @param series  the series.
         * @param item  the item.
         * @param x  the x-value.
         * @param y  the y-value.
         *
         * @return the image.
         */
        protected Image getImage(final Plot plot, final int series, final int item,
                                 final double x, final double y) {
            if (item % 10 == 0) {
                return ballImage;
            }
            else if (item == 42) {
                return arrowImage;
            }
            return null;
        }

        /**
         * Returns the image hot spot.
         *
         * @param plot  the plot.
         * @param series  the series.
         * @param item  the item.
         * @param x  the x-value.
         * @param y  the y-value.
         * @param image  the image.
         *
         * @return the image hot spot.
         */
        protected Point getImageHotspot(final Plot plot, final int series, final int item,
                                        final double x, final double y, final Image image) {
            if (image == arrowImage) {
                // the arrow has the hot spot at the bottom left
                return new Point(0, image.getHeight(null));
            }
            return super.getImageHotspot(plot, series, item, x, y, image);
        }
    }

    // ****************************************************************************
    // * JFREECHART DEVELOPER GUIDE                                               *
    // * The JFreeChart Developer Guide, written by David Gilbert, is available   *
    // * to purchase from Object Refinery Limited:                                *
    // *                                                                          *
    // * http://www.object-refinery.com/jfreechart/guide.html                     *
    // *                                                                          *
    // * Sales are used to provide funding for the JFreeChart project - please    *
    // * support us so that we can continue developing free software.             *
    // ****************************************************************************

    /**
     * Starting point for the demonstration application.
     *
     * @param args  ignored.
     */
    public static void main(final String[] args) {

        final MultiShapesXYDemo demo = new MultiShapesXYDemo("XYPlot With Multiple Shapes");
        demo.pack();
        RefineryUtilities.centerFrameOnScreen(demo);
        demo.setVisible(true);

    }

}
 jfreechart-1.0.0-rc1.zip( 3,559 k)
Related examples in the same category