JFreeChart: Overlaid Bar Chart Demo
/* ===========================================================
* JFreeChart : a free chart library for the Java(tm) platform
* ===========================================================
*
* (C) Copyright 2000-2004, by Object Refinery Limited and Contributors.
*
* Project Info: http://www.jfree.org/jfreechart/index.html
*
* This library is free software; you can redistribute it and/or modify it under the terms
* of the GNU Lesser General Public License as published by the Free Software Foundation;
* either version 2.1 of the License, or (at your option) any later version.
*
* This library is distributed in the hope that it will be useful, but WITHOUT ANY WARRANTY;
* without even the implied warranty of MERCHANTABILITY or FITNESS FOR A PARTICULAR PURPOSE.
* See the GNU Lesser General Public License for more details.
*
* You should have received a copy of the GNU Lesser General Public License along with this
* library; if not, write to the Free Software Foundation, Inc., 59 Temple Place, Suite 330,
* Boston, MA 02111-1307, USA.
*
* [Java is a trademark or registered trademark of Sun Microsystems, Inc.
* in the United States and other countries.]
*
* -------------------------
* OverlaidBarChartDemo.java
* -------------------------
* (C) Copyright 2002-2004, by Object Refinery Limited.
*
* Original Author: David Gilbert (for Object Refinery Limited);
* Contributor(s): -;
*
* $Id: OverlaidBarChartDemo.java,v 1.36 2004/06/02 09:48:24 mungady Exp $
*
* Changes
* -------
* 20-Sep-2002 : Version 1 (DG);
* 11-Oct-2002 : Added tooltips, modified series colors, centered frame on screen (DG);
* 11-Feb-2003 : Fixed bug where category labels were not showing on the axis (DG);
* 08-Sep-2003 : Bug fix (DG);
* 02-Jun-2004 : Set the rendering order (DG);
*
*/
package org.jfree.chart.demo;
import org.jfree.chart.ChartPanel;
import org.jfree.chart.JFreeChart;
import org.jfree.chart.axis.CategoryAxis;
import org.jfree.chart.axis.CategoryLabelPositions;
import org.jfree.chart.axis.NumberAxis;
import org.jfree.chart.axis.ValueAxis;
import org.jfree.chart.plot.CategoryPlot;
import org.jfree.chart.plot.DatasetRenderingOrder;
import org.jfree.chart.plot.PlotOrientation;
import org.jfree.chart.renderer.category.BarRenderer;
import org.jfree.chart.renderer.category.CategoryItemRenderer;
import org.jfree.chart.renderer.category.LineAndShapeRenderer;
import org.jfree.data.category.DefaultCategoryDataset;
import org.jfree.ui.ApplicationFrame;
import org.jfree.ui.RefineryUtilities;
/**
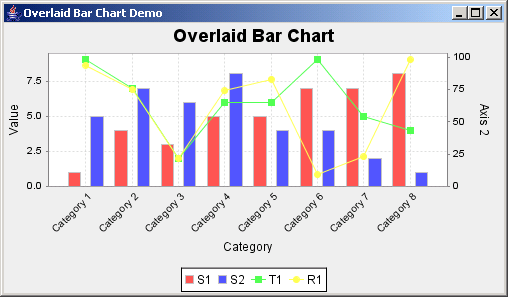
* A simple demonstration application showing how to create a bar chart overlaid
* with a line chart.
*/
public class OverlaidBarChartDemo extends ApplicationFrame {
/**
* Default constructor.
*
* @param title the frame title.
*/
public OverlaidBarChartDemo(final String title) {
super(title);
// create the first dataset...
DefaultCategoryDataset dataset1 = new DefaultCategoryDataset();
dataset1.addValue(1.0, "S1", "Category 1");
dataset1.addValue(4.0, "S1", "Category 2");
dataset1.addValue(3.0, "S1", "Category 3");
dataset1.addValue(5.0, "S1", "Category 4");
dataset1.addValue(5.0, "S1", "Category 5");
dataset1.addValue(7.0, "S1", "Category 6");
dataset1.addValue(7.0, "S1", "Category 7");
dataset1.addValue(8.0, "S1", "Category 8");
dataset1.addValue(5.0, "S2", "Category 1");
dataset1.addValue(7.0, "S2", "Category 2");
dataset1.addValue(6.0, "S2", "Category 3");
dataset1.addValue(8.0, "S2", "Category 4");
dataset1.addValue(4.0, "S2", "Category 5");
dataset1.addValue(4.0, "S2", "Category 6");
dataset1.addValue(2.0, "S2", "Category 7");
dataset1.addValue(1.0, "S2", "Category 8");
// create the first renderer...
// final CategoryLabelGenerator generator = new StandardCategoryLabelGenerator();
final CategoryItemRenderer renderer = new BarRenderer();
// renderer.setLabelGenerator(generator);
renderer.setItemLabelsVisible(true);
final CategoryPlot plot = new CategoryPlot();
plot.setDataset(dataset1);
plot.setRenderer(renderer);
plot.setDomainAxis(new CategoryAxis("Category"));
plot.setRangeAxis(new NumberAxis("Value"));
plot.setOrientation(PlotOrientation.VERTICAL);
plot.setRangeGridlinesVisible(true);
plot.setDomainGridlinesVisible(true);
// now create the second dataset and renderer...
DefaultCategoryDataset dataset2 = new DefaultCategoryDataset();
dataset2.addValue(9.0, "T1", "Category 1");
dataset2.addValue(7.0, "T1", "Category 2");
dataset2.addValue(2.0, "T1", "Category 3");
dataset2.addValue(6.0, "T1", "Category 4");
dataset2.addValue(6.0, "T1", "Category 5");
dataset2.addValue(9.0, "T1", "Category 6");
dataset2.addValue(5.0, "T1", "Category 7");
dataset2.addValue(4.0, "T1", "Category 8");
final CategoryItemRenderer renderer2 = new LineAndShapeRenderer();
plot.setDataset(1, dataset2);
plot.setRenderer(1, renderer2);
// create the third dataset and renderer...
final ValueAxis rangeAxis2 = new NumberAxis("Axis 2");
plot.setRangeAxis(1, rangeAxis2);
DefaultCategoryDataset dataset3 = new DefaultCategoryDataset();
dataset3.addValue(94.0, "R1", "Category 1");
dataset3.addValue(75.0, "R1", "Category 2");
dataset3.addValue(22.0, "R1", "Category 3");
dataset3.addValue(74.0, "R1", "Category 4");
dataset3.addValue(83.0, "R1", "Category 5");
dataset3.addValue(9.0, "R1", "Category 6");
dataset3.addValue(23.0, "R1", "Category 7");
dataset3.addValue(98.0, "R1", "Category 8");
plot.setDataset(2, dataset3);
final CategoryItemRenderer renderer3 = new LineAndShapeRenderer();
plot.setRenderer(2, renderer3);
plot.mapDatasetToRangeAxis(2, 1);
// change the rendering order so the primary dataset appears "behind" the
// other datasets...
plot.setDatasetRenderingOrder(DatasetRenderingOrder.FORWARD);
plot.getDomainAxis().setCategoryLabelPositions(CategoryLabelPositions.UP_45);
final JFreeChart chart = new JFreeChart(plot);
chart.setTitle("Overlaid Bar Chart");
// chart.setLegend(new StandardLegend());
// add the chart to a panel...
final ChartPanel chartPanel = new ChartPanel(chart);
chartPanel.setPreferredSize(new java.awt.Dimension(500, 270));
setContentPane(chartPanel);
}
// ****************************************************************************
// * JFREECHART DEVELOPER GUIDE *
// * The JFreeChart Developer Guide, written by David Gilbert, is available *
// * to purchase from Object Refinery Limited: *
// * *
// * http://www.object-refinery.com/jfreechart/guide.html *
// * *
// * Sales are used to provide funding for the JFreeChart project - please *
// * support us so that we can continue developing free software. *
// ****************************************************************************
/**
* Starting point for the demonstration application.
*
* @param args ignored.
*/
public static void main(final String[] args) {
final OverlaidBarChartDemo demo = new OverlaidBarChartDemo("Overlaid Bar Chart Demo");
demo.pack();
RefineryUtilities.centerFrameOnScreen(demo);
demo.setVisible(true);
}
}
 jfreechart-1.0.0-rc1.zip( 3,559 k)
Related examples in the same category