JFreeChart: Stacked Bar Chart Demo 4
/* ===========================================================
* JFreeChart : a free chart library for the Java(tm) platform
* ===========================================================
*
* (C) Copyright 2000-2004, by Object Refinery Limited and Contributors.
*
* Project Info: http://www.jfree.org/jfreechart/index.html
*
* This library is free software; you can redistribute it and/or modify it under the terms
* of the GNU Lesser General Public License as published by the Free Software Foundation;
* either version 2.1 of the License, or (at your option) any later version.
*
* This library is distributed in the hope that it will be useful, but WITHOUT ANY WARRANTY;
* without even the implied warranty of MERCHANTABILITY or FITNESS FOR A PARTICULAR PURPOSE.
* See the GNU Lesser General Public License for more details.
*
* You should have received a copy of the GNU Lesser General Public License along with this
* library; if not, write to the Free Software Foundation, Inc., 59 Temple Place, Suite 330,
* Boston, MA 02111-1307, USA.
*
* [Java is a trademark or registered trademark of Sun Microsystems, Inc.
* in the United States and other countries.]
*
* -------------------------
* StackedBarChartDemo4.java
* -------------------------
* (C) Copyright 2004, by Object Refinery Limited and Contributors.
*
* Original Author: David Gilbert (for Object Refinery Limited);
* Contributor(s): -;
*
* $Id: StackedBarChartDemo4.java,v 1.6 2004/05/12 16:01:58 mungady Exp $
*
* Changes
* -------
* 29-Apr-2004 : Version 1 (DG);
*
*/
package org.jfree.chart.demo;
import java.awt.Color;
import java.awt.GradientPaint;
import java.awt.Paint;
import org.jfree.chart.ChartFactory;
import org.jfree.chart.ChartPanel;
import org.jfree.chart.JFreeChart;
import org.jfree.chart.LegendItem;
import org.jfree.chart.LegendItemCollection;
import org.jfree.chart.axis.SubCategoryAxis;
import org.jfree.chart.plot.CategoryPlot;
import org.jfree.chart.plot.PlotOrientation;
import org.jfree.chart.renderer.category.GroupedStackedBarRenderer;
import org.jfree.data.KeyToGroupMap;
import org.jfree.data.category.CategoryDataset;
import org.jfree.data.category.DefaultCategoryDataset;
import org.jfree.ui.ApplicationFrame;
import org.jfree.ui.GradientPaintTransformType;
import org.jfree.ui.RefineryUtilities;
import org.jfree.ui.StandardGradientPaintTransformer;
/**
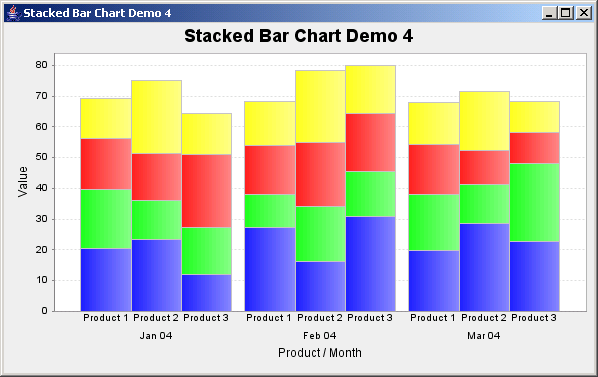
* A simple demonstration application showing how to create a stacked bar chart
* using data from a {@link CategoryDataset}.
*/
public class StackedBarChartDemo4 extends ApplicationFrame {
/**
* Creates a new demo.
*
* @param title the frame title.
*/
public StackedBarChartDemo4(final String title) {
super(title);
final CategoryDataset dataset = createDataset();
final JFreeChart chart = createChart(dataset);
final ChartPanel chartPanel = new ChartPanel(chart);
chartPanel.setPreferredSize(new java.awt.Dimension(590, 350));
setContentPane(chartPanel);
}
/**
* Creates a sample dataset.
*
* @return A sample dataset.
*/
private CategoryDataset createDataset() {
DefaultCategoryDataset result = new DefaultCategoryDataset();
result.addValue(20.3, "Product 1 (US)", "Jan 04");
result.addValue(27.2, "Product 1 (US)", "Feb 04");
result.addValue(19.7, "Product 1 (US)", "Mar 04");
result.addValue(19.4, "Product 1 (Europe)", "Jan 04");
result.addValue(10.9, "Product 1 (Europe)", "Feb 04");
result.addValue(18.4, "Product 1 (Europe)", "Mar 04");
result.addValue(16.5, "Product 1 (Asia)", "Jan 04");
result.addValue(15.9, "Product 1 (Asia)", "Feb 04");
result.addValue(16.1, "Product 1 (Asia)", "Mar 04");
result.addValue(13.2, "Product 1 (Middle East)", "Jan 04");
result.addValue(14.4, "Product 1 (Middle East)", "Feb 04");
result.addValue(13.7, "Product 1 (Middle East)", "Mar 04");
result.addValue(23.3, "Product 2 (US)", "Jan 04");
result.addValue(16.2, "Product 2 (US)", "Feb 04");
result.addValue(28.7, "Product 2 (US)", "Mar 04");
result.addValue(12.7, "Product 2 (Europe)", "Jan 04");
result.addValue(17.9, "Product 2 (Europe)", "Feb 04");
result.addValue(12.6, "Product 2 (Europe)", "Mar 04");
result.addValue(15.4, "Product 2 (Asia)", "Jan 04");
result.addValue(21.0, "Product 2 (Asia)", "Feb 04");
result.addValue(11.1, "Product 2 (Asia)", "Mar 04");
result.addValue(23.8, "Product 2 (Middle East)", "Jan 04");
result.addValue(23.4, "Product 2 (Middle East)", "Feb 04");
result.addValue(19.3, "Product 2 (Middle East)", "Mar 04");
result.addValue(11.9, "Product 3 (US)", "Jan 04");
result.addValue(31.0, "Product 3 (US)", "Feb 04");
result.addValue(22.7, "Product 3 (US)", "Mar 04");
result.addValue(15.3, "Product 3 (Europe)", "Jan 04");
result.addValue(14.4, "Product 3 (Europe)", "Feb 04");
result.addValue(25.3, "Product 3 (Europe)", "Mar 04");
result.addValue(23.9, "Product 3 (Asia)", "Jan 04");
result.addValue(19.0, "Product 3 (Asia)", "Feb 04");
result.addValue(10.1, "Product 3 (Asia)", "Mar 04");
result.addValue(13.2, "Product 3 (Middle East)", "Jan 04");
result.addValue(15.5, "Product 3 (Middle East)", "Feb 04");
result.addValue(10.1, "Product 3 (Middle East)", "Mar 04");
return result;
}
/**
* Creates a sample chart.
*
* @param dataset the dataset for the chart.
*
* @return A sample chart.
*/
private JFreeChart createChart(final CategoryDataset dataset) {
final JFreeChart chart = ChartFactory.createStackedBarChart(
"Stacked Bar Chart Demo 4", // chart title
"Category", // domain axis label
"Value", // range axis label
dataset, // data
PlotOrientation.VERTICAL, // the plot orientation
true, // legend
true, // tooltips
false // urls
);
GroupedStackedBarRenderer renderer = new GroupedStackedBarRenderer();
KeyToGroupMap map = new KeyToGroupMap("G1");
map.mapKeyToGroup("Product 1 (US)", "G1");
map.mapKeyToGroup("Product 1 (Europe)", "G1");
map.mapKeyToGroup("Product 1 (Asia)", "G1");
map.mapKeyToGroup("Product 1 (Middle East)", "G1");
map.mapKeyToGroup("Product 2 (US)", "G2");
map.mapKeyToGroup("Product 2 (Europe)", "G2");
map.mapKeyToGroup("Product 2 (Asia)", "G2");
map.mapKeyToGroup("Product 2 (Middle East)", "G2");
map.mapKeyToGroup("Product 3 (US)", "G3");
map.mapKeyToGroup("Product 3 (Europe)", "G3");
map.mapKeyToGroup("Product 3 (Asia)", "G3");
map.mapKeyToGroup("Product 3 (Middle East)", "G3");
renderer.setSeriesToGroupMap(map);
renderer.setItemMargin(0.0);
Paint p1 = new GradientPaint(
0.0f, 0.0f, new Color(0x22, 0x22, 0xFF), 0.0f, 0.0f, new Color(0x88, 0x88, 0xFF)
);
renderer.setSeriesPaint(0, p1);
renderer.setSeriesPaint(4, p1);
renderer.setSeriesPaint(8, p1);
Paint p2 = new GradientPaint(
0.0f, 0.0f, new Color(0x22, 0xFF, 0x22), 0.0f, 0.0f, new Color(0x88, 0xFF, 0x88)
);
renderer.setSeriesPaint(1, p2);
renderer.setSeriesPaint(5, p2);
renderer.setSeriesPaint(9, p2);
Paint p3 = new GradientPaint(
0.0f, 0.0f, new Color(0xFF, 0x22, 0x22), 0.0f, 0.0f, new Color(0xFF, 0x88, 0x88)
);
renderer.setSeriesPaint(2, p3);
renderer.setSeriesPaint(6, p3);
renderer.setSeriesPaint(10, p3);
Paint p4 = new GradientPaint(
0.0f, 0.0f, new Color(0xFF, 0xFF, 0x22), 0.0f, 0.0f, new Color(0xFF, 0xFF, 0x88)
);
renderer.setSeriesPaint(3, p4);
renderer.setSeriesPaint(7, p4);
renderer.setSeriesPaint(11, p4);
renderer.setGradientPaintTransformer(
new StandardGradientPaintTransformer(GradientPaintTransformType.HORIZONTAL)
);
SubCategoryAxis domainAxis = new SubCategoryAxis("Product / Month");
domainAxis.setCategoryMargin(0.05);
domainAxis.addSubCategory("Product 1");
domainAxis.addSubCategory("Product 2");
domainAxis.addSubCategory("Product 3");
CategoryPlot plot = (CategoryPlot) chart.getPlot();
plot.setDomainAxis(domainAxis);
//plot.setDomainAxisLocation(AxisLocation.TOP_OR_RIGHT);
plot.setRenderer(renderer);
plot.setFixedLegendItems(createLegendItems());
return chart;
}
/**
* Creates the legend items for the chart. In this case, we set them manually because we
* only want legend items for a subset of the data series.
*
* @return The legend items.
*/
private LegendItemCollection createLegendItems() {
LegendItemCollection result = new LegendItemCollection();
// LegendItem item1 = new LegendItem("US", new Color(0x22, 0x22, 0xFF));
// LegendItem item2 = new LegendItem("Europe", new Color(0x22, 0xFF, 0x22));
// LegendItem item3 = new LegendItem("Asia", new Color(0xFF, 0x22, 0x22));
// LegendItem item4 = new LegendItem("Middle East", new Color(0xFF, 0xFF, 0x22));
// result.add(item1);
// result.add(item2);
// result.add(item3);
// result.add(item4);
return result;
}
// ****************************************************************************
// * JFREECHART DEVELOPER GUIDE *
// * The JFreeChart Developer Guide, written by David Gilbert, is available *
// * to purchase from Object Refinery Limited: *
// * *
// * http://www.object-refinery.com/jfreechart/guide.html *
// * *
// * Sales are used to provide funding for the JFreeChart project - please *
// * support us so that we can continue developing free software. *
// ****************************************************************************
/**
* Starting point for the demonstration application.
*
* @param args ignored.
*/
public static void main(final String[] args) {
final StackedBarChartDemo4 demo = new StackedBarChartDemo4("Stacked Bar Chart Demo 4");
demo.pack();
RefineryUtilities.centerFrameOnScreen(demo);
demo.setVisible(true);
}
}
 jfreechart-1.0.0-rc1.zip( 3,559 k)
Related examples in the same category