JFreeChart: Time Series Demo 2 with quarterly data
/* ===========================================================
* JFreeChart : a free chart library for the Java(tm) platform
* ===========================================================
*
* (C) Copyright 2000-2004, by Object Refinery Limited and Contributors.
*
* Project Info: http://www.jfree.org/jfreechart/index.html
*
* This library is free software; you can redistribute it and/or modify it under the terms
* of the GNU Lesser General Public License as published by the Free Software Foundation;
* either version 2.1 of the License, or (at your option) any later version.
*
* This library is distributed in the hope that it will be useful, but WITHOUT ANY WARRANTY;
* without even the implied warranty of MERCHANTABILITY or FITNESS FOR A PARTICULAR PURPOSE.
* See the GNU Lesser General Public License for more details.
*
* You should have received a copy of the GNU Lesser General Public License along with this
* library; if not, write to the Free Software Foundation, Inc., 59 Temple Place, Suite 330,
* Boston, MA 02111-1307, USA.
*
* [Java is a trademark or registered trademark of Sun Microsystems, Inc.
* in the United States and other countries.]
*
* --------------------
* TimeSeriesDemo2.java
* --------------------
* (C) Copyright 2002-2004, by Object Refinery Limited and Contributors.
*
* Original Author: David Gilbert (for Object Refinery Limited);
* Contributor(s): -;
*
* $Id: TimeSeriesDemo2.java,v 1.12 2004/04/26 19:12:03 taqua Exp $
*
* Changes
* -------
* 08-Apr-2002 : Version 1 (DG);
*
*/
package org.jfree.chart.demo;
import org.jfree.chart.ChartFactory;
import org.jfree.chart.ChartPanel;
import org.jfree.chart.JFreeChart;
import org.jfree.chart.plot.ValueMarker;
import org.jfree.data.time.Quarter;
import org.jfree.data.time.TimeSeries;
import org.jfree.data.time.TimeSeriesCollection;
import org.jfree.ui.ApplicationFrame;
import org.jfree.ui.RefineryUtilities;
/**
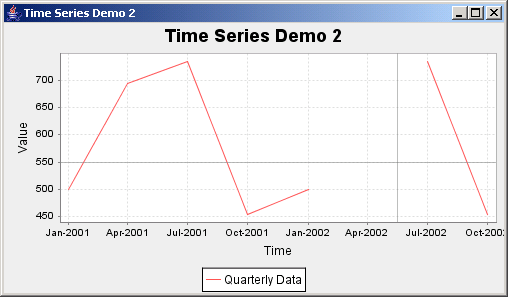
* A demo showing a time series (quarterly data) with a <code>null</code> value. The
* <code>null</code> value causes a gap in the line connecting the data points.
*
*/
public class TimeSeriesDemo2 extends ApplicationFrame {
/**
* A demonstration application showing a quarterly time series containing a null value.
*
* @param title the frame title.
*/
public TimeSeriesDemo2(final String title) {
super(title);
final TimeSeries series = new TimeSeries("Quarterly Data", Quarter.class);
series.add(new Quarter(1, 2001), 500.2);
series.add(new Quarter(2, 2001), 694.1);
series.add(new Quarter(3, 2001), 734.4);
series.add(new Quarter(4, 2001), 453.2);
series.add(new Quarter(1, 2002), 500.2);
series.add(new Quarter(2, 2002), null);
series.add(new Quarter(3, 2002), 734.4);
series.add(new Quarter(4, 2002), 453.2);
final TimeSeriesCollection dataset = new TimeSeriesCollection(series);
final JFreeChart chart = ChartFactory.createTimeSeriesChart(
"Time Series Demo 2",
"Time",
"Value",
dataset,
true,
true,
false
);
chart.getXYPlot().addRangeMarker(new ValueMarker(550.0));
final Quarter q = new Quarter(2, 2002);
chart.getXYPlot().addDomainMarker(new ValueMarker(q.getMiddleMillisecond()));
final ChartPanel chartPanel = new ChartPanel(chart);
chartPanel.setPreferredSize(new java.awt.Dimension(500, 270));
setContentPane(chartPanel);
}
// ****************************************************************************
// * JFREECHART DEVELOPER GUIDE *
// * The JFreeChart Developer Guide, written by David Gilbert, is available *
// * to purchase from Object Refinery Limited: *
// * *
// * http://www.object-refinery.com/jfreechart/guide.html *
// * *
// * Sales are used to provide funding for the JFreeChart project - please *
// * support us so that we can continue developing free software. *
// ****************************************************************************
/**
* Starting point for the demonstration application.
*
* @param args ignored.
*/
public static void main(final String[] args) {
final TimeSeriesDemo2 demo = new TimeSeriesDemo2("Time Series Demo 2");
demo.pack();
RefineryUtilities.centerFrameOnScreen(demo);
demo.setVisible(true);
}
}
 jfreechart-1.0.0-rc1.zip( 3,559 k)
Related examples in the same category