JFreeChart: Waterfall Chart Demo 2
/* ===========================================================
* JFreeChart : a free chart library for the Java(tm) platform
* ===========================================================
*
* (C) Copyright 2000-2004, by Object Refinery Limited and Contributors.
*
* Project Info: http://www.jfree.org/jfreechart/index.html
*
* This library is free software; you can redistribute it and/or modify it under the terms
* of the GNU Lesser General Public License as published by the Free Software Foundation;
* either version 2.1 of the License, or (at your option) any later version.
*
* This library is distributed in the hope that it will be useful, but WITHOUT ANY WARRANTY;
* without even the implied warranty of MERCHANTABILITY or FITNESS FOR A PARTICULAR PURPOSE.
* See the GNU Lesser General Public License for more details.
*
* You should have received a copy of the GNU Lesser General Public License along with this
* library; if not, write to the Free Software Foundation, Inc., 59 Temple Place, Suite 330,
* Boston, MA 02111-1307, USA.
*
* [Java is a trademark or registered trademark of Sun Microsystems, Inc.
* in the United States and other countries.]
*
* ------------------------
* WaterfallChartDemo2.java
* ------------------------
* (C) Copyright 2003, 2004, by Object Refinery Limited and Contributors.
*
* Original Author: Darshan Shah;
* Contributor(s): David Gilbert (for Object Refinery Limited);
*
* $Id: WaterfallChartDemo2.java,v 1.11 2004/05/10 16:45:23 mungady Exp $
*
* Changes
* -------
* 20-Oct-2003 : Version 1, based on code contributed by Darshan Shah (DG);
*
*/
package org.jfree.chart.demo;
import java.awt.BasicStroke;
import java.awt.Color;
import java.text.DecimalFormat;
import org.jfree.chart.ChartPanel;
import org.jfree.chart.JFreeChart;
import org.jfree.chart.axis.CategoryAxis;
import org.jfree.chart.axis.NumberAxis;
import org.jfree.chart.axis.NumberTickUnit;
import org.jfree.chart.axis.TickUnits;
import org.jfree.chart.plot.CategoryPlot;
import org.jfree.chart.plot.ValueMarker;
import org.jfree.chart.renderer.category.WaterfallBarRenderer;
import org.jfree.data.category.CategoryDataset;
import org.jfree.data.category.DefaultCategoryDataset;
import org.jfree.ui.ApplicationFrame;
import org.jfree.ui.Layer;
import org.jfree.ui.RefineryUtilities;
/**
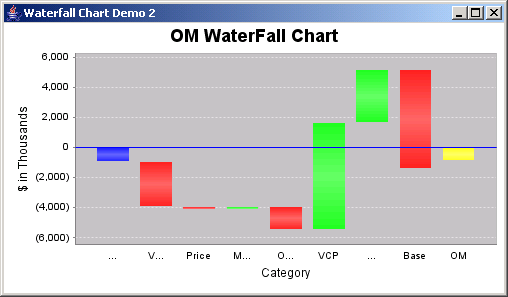
* A sample waterfall chart.
*/
public class WaterfallChartDemo2 extends ApplicationFrame {
/**
* Creates a new WaterFall Chart demo.
*
* @param title the frame title.
*/
public WaterfallChartDemo2(final String title) {
super(title);
final CategoryDataset dataset = createDataset();
final JFreeChart chart = createChart(dataset);
final ChartPanel chartPanel = new ChartPanel(chart);
chartPanel.setPreferredSize(new java.awt.Dimension(500, 270));
chartPanel.setEnforceFileExtensions(false);
setContentPane(chartPanel);
}
/**
* Creates a sample dataset for the demo.
*
* @return A sample dataset.
*/
private CategoryDataset createDataset() {
final DefaultCategoryDataset dataset = new DefaultCategoryDataset();
dataset.addValue(-890.76, "S1", "PY OM");
dataset.addValue(-3021.51, "S1", "Vol CM");
dataset.addValue(-218.32, "S1", "Price");
dataset.addValue(221.75, "S1", "Mat Inf");
dataset.addValue(-1504.1, "S1", "Oth Inf");
dataset.addValue(7103.8, "S1", "VCP");
dataset.addValue(3503.3, "S1", "CM FX");
dataset.addValue(-6561.97, "S1", "Base");
dataset.addValue(-824.25, "S1", "OM");
return dataset;
}
/**
* Returns the chart.
*
* @param dataset the dataset.
*
* @return The chart.
*/
private JFreeChart createChart(final CategoryDataset dataset) {
final CategoryAxis xAxis = new CategoryAxis("Category");
final NumberAxis yAxis = new NumberAxis("$ in Thousands");
yAxis.setLowerMargin(0.10);
yAxis.setUpperMargin(0.10);
// create a custom tick unit collection...
final DecimalFormat formatter = new DecimalFormat("##,###");
formatter.setNegativePrefix("(");
formatter.setNegativeSuffix(")");
final TickUnits standardUnits = new TickUnits();
standardUnits.add(new NumberTickUnit(200, formatter));
standardUnits.add(new NumberTickUnit(500, formatter));
standardUnits.add(new NumberTickUnit(1000, formatter));
standardUnits.add(new NumberTickUnit(2000, formatter));
standardUnits.add(new NumberTickUnit(5000, formatter));
yAxis.setStandardTickUnits(standardUnits);
// ****************************************************************************
// * JFREECHART DEVELOPER GUIDE *
// * The JFreeChart Developer Guide, written by David Gilbert, is available *
// * to purchase from Object Refinery Limited: *
// * *
// * http://www.object-refinery.com/jfreechart/guide.html *
// * *
// * Sales are used to provide funding for the JFreeChart project - please *
// * support us so that we can continue developing free software. *
// ****************************************************************************
final DecimalFormat labelFormatter = new DecimalFormat("##,###");
labelFormatter.setNegativePrefix("(");
labelFormatter.setNegativeSuffix(")");
final WaterfallBarRenderer renderer = new WaterfallBarRenderer();
// renderer.setLabelGenerator(
// new StandardCategoryLabelGenerator("{2}", labelFormatter)
// );
renderer.setItemLabelsVisible(Boolean.TRUE);
final CategoryPlot plot = new CategoryPlot(dataset, xAxis, yAxis, renderer);
plot.setBackgroundPaint(Color.lightGray);
plot.setRangeGridlinePaint(Color.white);
plot.setRangeGridlinesVisible(true);
final ValueMarker baseline = new ValueMarker(0.0);
baseline.setPaint(Color.blue);
baseline.setStroke(new BasicStroke(1.1f));
plot.addRangeMarker(baseline, Layer.FOREGROUND);
final JFreeChart chart = new JFreeChart("OM WaterFall Chart",
JFreeChart.DEFAULT_TITLE_FONT, plot, false);
chart.setBackgroundPaint(Color.white);
return chart;
}
/**
* Starting point for the demo.
*
* @param args ignored.
*/
public static void main(final String[] args) {
final WaterfallChartDemo2 demo = new WaterfallChartDemo2("Waterfall Chart Demo 2");
demo.pack();
RefineryUtilities.centerFrameOnScreen(demo);
demo.setVisible(true);
}
}
 jfreechart-1.0.0-rc1.zip( 3,559 k)
Related examples in the same category