Chart « Java

Home
Java
1.2D Graphics GUI
2.3D
3.Advanced Graphics
4.Ant
5.Apache Common
6.Chart
7.Class
8.Collections Data Structure
9.Data Type
10.Database SQL JDBC
11.Design Pattern
12.Development Class
13.EJB3
14.Email
15.Event
16.File Input Output
17.Game
18.Generics
19.GWT
20.Hibernate
21.I18N
22.J2EE
23.J2ME
24.JDK 6
25.JNDI LDAP
26.JPA
27.JSP
28.JSTL
29.Language Basics
30.Network Protocol
31.PDF RTF
32.Reflection
33.Regular Expressions
34.Scripting
35.Security
36.Servlets
37.Spring
38.Swing Components
39.Swing JFC
40.SWT JFace Eclipse
41.Threads
42.Tiny Application
43.Velocity
44.Web Services SOA
45.XML
Java » ChartScreenshots 
2D Graphics GUI
3D
Advanced Graphics
Chart
Class
Collections Data Structure
Data Type
Design Pattern
Development Class
Event
File Input Output
Game
Generics
GWT
I18N
J2EE
J2ME
JSP
Language Basics
Network Protocol
PDF RTF
Reflection
Regular Expressions
Security
Swing Components
Swing JFC
SWT JFace Eclipse
Threads
Tiny Application
XML
Image index for Chart : 1  2  3  4  5  6  7  8  9  10  11  12  13  14  15  16  17  18  19  20  21  22  23  24  25  26  27  

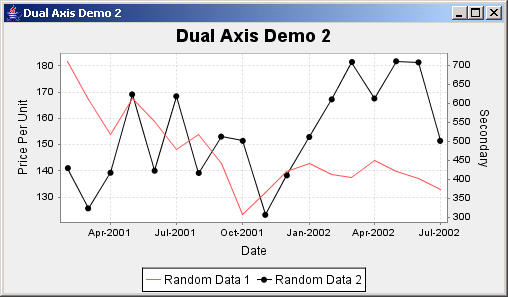
JFreeChart: Dual Axis Demo 2  Click image to read the source code.


JFreeChart: Dual Axis Demo 2


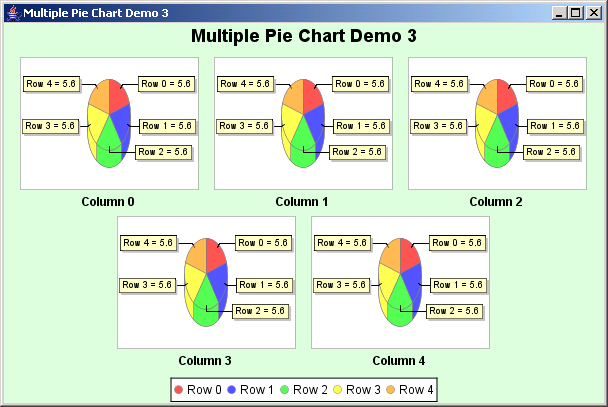
JFreeChart: Multiple Pie Chart Demo 3  Click image to read the source code.


JFreeChart: Multiple Pie Chart Demo 3


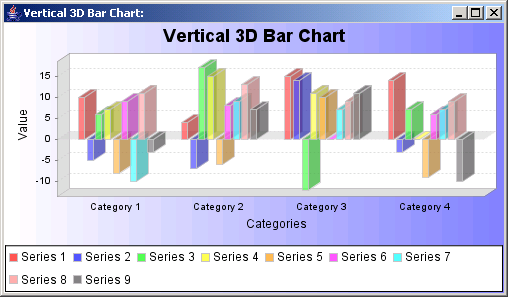
Vertical bars with a 3D effect: representing data from a Category Data set  Click image to read the source code.


Vertical bars with a 3D effect: representing data from a Category Data set


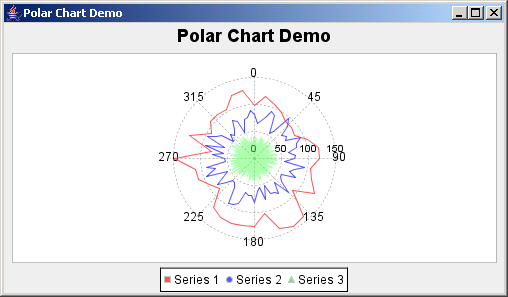
JFreeChart: Plot Orientation Demo  Click image to read the source code.


JFreeChart: Plot Orientation Demo


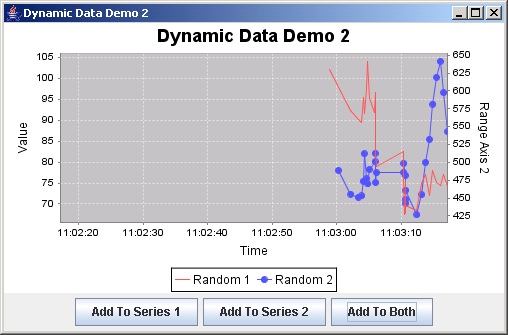
JFreeChart: Dynamic Data Demo 2  Click image to read the source code.


JFreeChart: Dynamic Data Demo 2


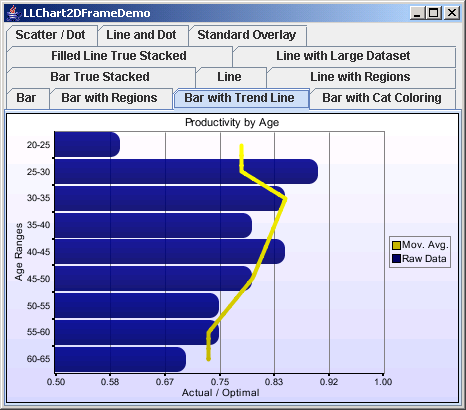
Chart2D: Vertical Bar Chart With Trend Line  Click image to read the source code.


Chart2D: Vertical Bar Chart With Trend Line


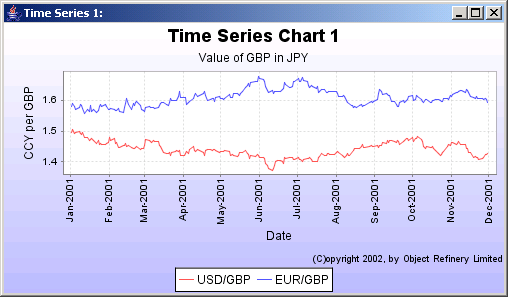
A time series chart, representing data from an XYDataset, use of multiple chart titles  Click image to read the source code.


A time series chart, representing data from an XYDataset, use of multiple chart titles


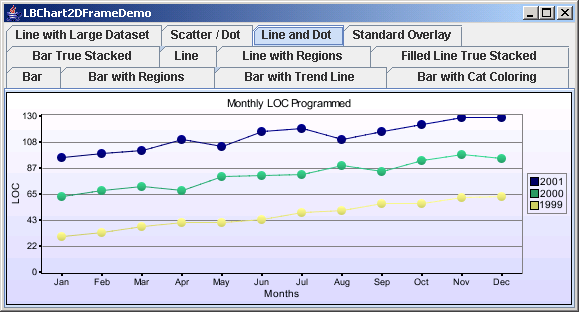
Chart2D: Line Chart With Scatter and Dot on the Line  Click image to read the source code.


Chart2D: Line Chart With Scatter and Dot on the Line


java2s.com  | Contact Us | Privacy Policy
Copyright 2009 - 12 Demo Source and Support. All rights reserved.
All other trademarks are property of their respective owners.