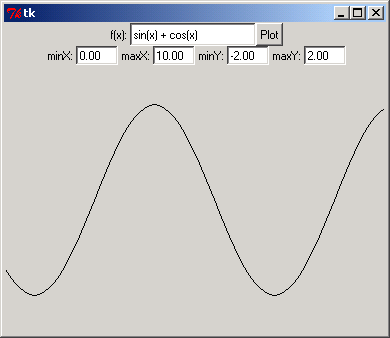
Draw Math Curve
from Tkinter import *
import math

root = Tk()

fram = Frame(root)
Label(fram,text='f(x):').pack(side=LEFT)
func = Entry(fram)
func.pack(side=LEFT, fill=BOTH, expand=1)
butt = Button(fram, text='Plot')
butt.pack(side=RIGHT)
fram.pack(side=TOP)

fram = Frame(root)
bounds = []
for label in 'minX', 'maxX', 'minY', 'maxY':
    Label(fram,text=label+':').pack(side=LEFT)
    edit = Entry(fram, width=6)
    edit.pack(side=LEFT)
    bounds.append(edit)
fram.pack(side=TOP)

c = Canvas(root)
c.pack(side=TOP, fill=BOTH, expand=1)

def minimax(values=[0.0, 1.0, 0.0, 1.0]):
    for i in range(4):
        edit = bounds[i]
        try: values[i] = float(edit.get())
        except: pass
        edit.delete(0, END)
        edit.insert(END, '%.2f'%values[i])
    return values

def plot():
    minx, maxx, miny, maxy = minimax()

    f = func.get()
    f = compile(f, f, 'eval')

    CX = c.winfo_width()
    CY = c.winfo_height()

    coords = []
    for i in range(0,CX,5):
        coords.append(i)
        x = minx + ((maxx-minx)*i)/CX
        y = eval(f, vars(math), {'x':x})
        j = CY*(y-miny)/(maxy-miny)
        coords.append(j)

    c.delete(ALL)
    c.create_line(*coords)

butt.config(command=plot)

f = 'sin(x) + cos(x)'
func.insert(END, f)
minimax([0.0, 10.0, -2.0, 2.0])

root.mainloop()
Related examples in the same category