Data-scaling algorithm and the curve-plotting routine - C++ File Stream
C++ examples for File Stream:cout
Description
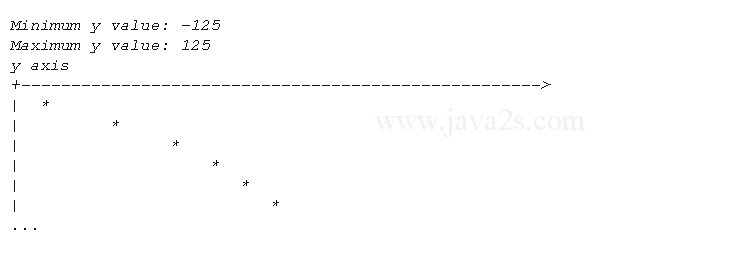
Data-scaling algorithm and the curve-plotting routine
Demo Code
#include <iostream>
#include <cmath>
using namespace std;
int main()/*ww w. j a v a 2  s. co m*/
{
   const int MAXPOINTS = 100;
   int i, npts, nval[MAXPOINTS];
   double x, fval, ymin, ymax, width, sval[MAXPOINTS];
   char label[] = "                      y axis";
   char axis[] = "+---------------------------------------------------->";
   char line[] = "|                                                ";
   ymax = 1.0e-5;
   ymin = 1.0e5;
   width = 53;
   i = 1;
   for (x = -5.0; x <= 5.0; x += 0.5)
   {
      sval[i] = pow(x,3.0);
      if (sval[i] > ymax) ymax = sval[i];
      if (sval[i] < ymin) ymin = sval[i];
      i++;
      if (i >= MAXPOINTS)
         break;  // don't exceed the maximum points
      }
      npts = i - 1;
      for (i=1; i <= npts; i++)
      {
         fval = (sval[i] - ymin)/(ymax - ymin) * (width - 1) + 1;
         nval[i] = fval + 0.5;  // convert to an integer value
      }
      // Produce the plot
      cout << "Minimum y value: " << ymin << endl;
      cout << "Maximum y value: " << ymax << endl;
      cout << label << endl;
      cout << axis << endl;
      for (i = 1; i <= npts; i++)
      {
         line[(nval[i] + 2)] = '*';   // set character to an asterisk
         cout << line << endl;        // output the line
         line[(nval[i] + 2)] = ' ';   // reset character to a blank
      }
      return 0;
}
Result
Related Tutorials
- Rounding float value to the nearest digit, tenth, hundredth, thousandth and ten-thousandth.
- Converting Fahrenheit to Celsius from 0 to 212 degrees to floating-point Celsius temperatures with 3 digits of precision.
- Printing a Table of ASCII Values
- Use cout to write to a specific file instead of to the standard display device
- Create custom output manipulator and a custom input manipulator called skip_digits().