BarChart : Bar Chart « Chart « Flex


BarChart

BarChart
         

<?xml version="1.0"?>
<mx:Application xmlns:mx="http://www.adobe.com/2006/mxml">
  <mx:Script>
     import mx.collections.ArrayCollection;
     [Bindable]
     public var myArray:ArrayCollection = new ArrayCollection([
        {Country:"A", GDP:1},
        {Country:"B", GDP:6},
        {Country:"C", GDP:4},
        {Country:"D", GDP:2}
     ]);
     [Bindable]
     public var myArray2:ArrayCollection = new ArrayCollection([
        {Country:"A", GDP:1},
        {Country:"B", GDP:2},
        {Country:"C", GDP:3},
        {Country:"D", GDP:4}
     ]);
</mx:Script>
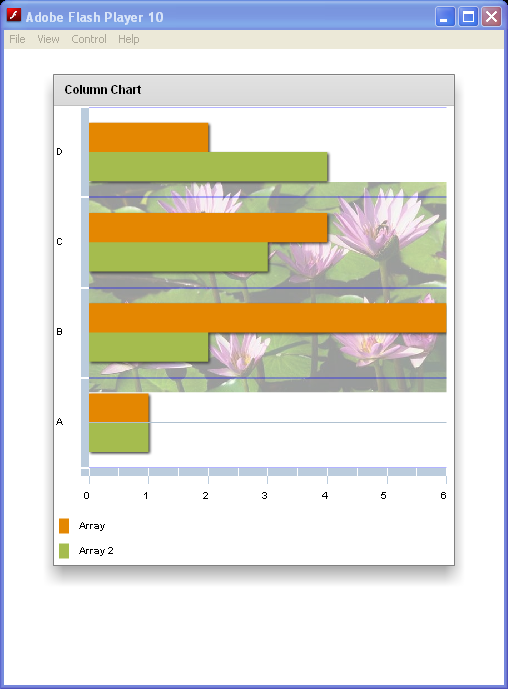
  <mx:Panel title="Column Chart">
     <mx:BarChart id="myChart" dataProvider="{myArray}" showDataTips="true">
        <mx:verticalAxis>
           <mx:CategoryAxis categoryField="Country"/>
        </mx:verticalAxis>
        <mx:series>
           <mx:BarSeries 
                dataProvider="{myArray}"
                xField="GDP"
                yField="Country"
                displayName="Array" />
           <mx:BarSeries
                dataProvider="{myArray2}"
                xField="GDP"
                yField="Country"
                displayName="Array 2" />
        </mx:series>
        <mx:annotationElements>
           <mx:GridLines>
            <mx:horizontalStroke>
                <mx:Stroke color="#0000FF" weight="2" alpha=".3" />
            </mx:horizontalStroke>
           </mx:GridLines>
        </mx:annotationElements>
        <mx:backgroundElements>
           <mx:Image verticalAlign="middle" source="@Embed('logo.jpg')" alpha=".4" />
        </mx:backgroundElements>
     </mx:BarChart>
     <mx:Legend dataProvider="{myChart}"/>
  </mx:Panel>
</mx:Application>


Related examples in the same category

1.A bar chart with a vertical axisA bar chart with a vertical axis
2.CSS for BarSeries and ColumnSeriesCSS for BarSeries and ColumnSeries
3.Setting fills with CSS for BarChartSetting fills with CSS for BarChart
4.Set up legend for Bar chartSet up legend for Bar chart
5.Series for Bar chartSeries for Bar chart
6.Bar Chart with ArrayCollectionBar Chart with ArrayCollection
7.Dynamically size Bar chartDynamically size Bar chart
8.Defines a line width of 2 pixels, with a dark/light gray border for BarChartDefines a line width of 2 pixels, with a dark/light gray border for BarChart
9.Basic BarChart SizeBasic BarChart Size
10.A simple BarChart control with data from asp.netA simple BarChart control with data from asp.net
11.Vertical Axis as the data seriesVertical Axis as the data series
12.Gradient Fills In ActionScriptGradient Fills In ActionScript
13.Setting the direction of legendsSetting the direction of legends
14.Legend with a border and title barLegend with a border and title bar
15.Name data series by using the displayName property of the series:Name data series by using the displayName property of the series:
16.Showing multiple DataTipsShowing multiple DataTips
17.Define a new callback function, dtFunc, that returns a formatted value for the DataTip:Define a new callback function, dtFunc, that returns a formatted value for the DataTip:
18.Create a custom legend in ActionScript.Create a custom legend in ActionScript.
19.Creating charts in ActionScript
20.Sets the angle property to 90, which specifies that the transition occurs from the top of the chart to the bottom.Sets the angle property to 90, which specifies that the transition occurs from the top of the chart to the bottom.
21.Use a LinearGradient class with three colors for a gradient fill of the chart's background:Use a LinearGradient class with three colors for a gradient fill of the chart's background:
22.Use fills to set the background of the chartsUse fills to set the background of the charts
23.To enable DataTips, set the value of the chart control's showDataTips property to trueTo enable DataTips, set the value of the chart control's showDataTips property to true
24.Use ColumnSet, BarSet, and AreaSet classes to combine groups of chart series,
25.Add a Legend to a chart in ActionScriptAdd a Legend to a chart in ActionScript