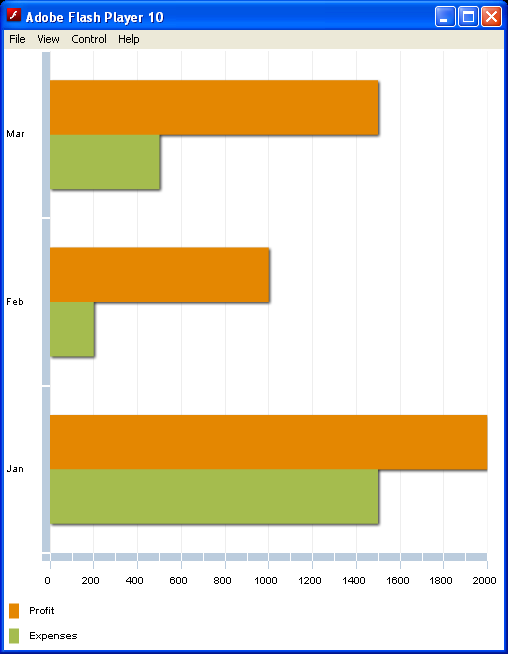
Basic BarChart Size : Bar Chart « Chart « Flex


Basic BarChart Size

Basic BarChart Size
         

<!--
Code from Flex 4 Documentation "Using Adobe Flex 4".

This user guide is licensed for use under the terms of the Creative Commons Attribution 
Non-Commercial 3.0 License. 

This License allows users to copy, distribute, and transmit the user guide for noncommercial 
purposes only so long as 
  (1) proper attribution to Adobe is given as the owner of the user guide; and 
  (2) any reuse or distribution of the user guide contains a notice that use of the user guide is governed by these terms. 
The best way to provide notice is to include the following link. 
To view a copy of this license, visit http://creativecommons.org/licenses/by-nc-sa/3.0/

-->


    <!-- charts/BasicBarSize.mxml -->
<s:Application xmlns:fx="http://ns.adobe.com/mxml/2009"
    xmlns:mx="library://ns.adobe.com/flex/mx" xmlns:s="library://ns.adobe.com/flex/spark"
    height="600">
    <s:layout>
        <s:VerticalLayout />
    </s:layout>
    <fx:Script> 
         
        import mx.collections.ArrayCollection; 
        [Bindable] 
        public var expenses:ArrayCollection = new ArrayCollection([ 
            {Month:"Jan", Profit:2000, Expenses:1500}, 
            {Month:"Feb", Profit:1000, Expenses:200}, 
            {Month:"Mar", Profit:1500, Expenses:500} 
        ]); 
      
    </fx:Script>
    <mx:BarChart id="myChart" dataProvider="{expenses}" height="100%"
        width="100%" showDataTips="true">
        <mx:verticalAxis>
            <mx:CategoryAxis dataProvider="{expenses}"
                categoryField="Month" />
        </mx:verticalAxis>
        <mx:series>
            <mx:BarSeries yField="Month" xField="Profit"
                displayName="Profit" />
            <mx:BarSeries yField="Month" xField="Expenses"
                displayName="Expenses" />
        </mx:series>
    </mx:BarChart>
    <mx:Legend dataProvider="{myChart}" />
</s:Application>


Related examples in the same category

1.A bar chart with a vertical axisA bar chart with a vertical axis
2.CSS for BarSeries and ColumnSeriesCSS for BarSeries and ColumnSeries
3.Setting fills with CSS for BarChartSetting fills with CSS for BarChart
4.Set up legend for Bar chartSet up legend for Bar chart
5.Series for Bar chartSeries for Bar chart
6.Bar Chart with ArrayCollectionBar Chart with ArrayCollection
7.Dynamically size Bar chartDynamically size Bar chart
8.Defines a line width of 2 pixels, with a dark/light gray border for BarChartDefines a line width of 2 pixels, with a dark/light gray border for BarChart
9.BarChartBarChart
10.A simple BarChart control with data from asp.netA simple BarChart control with data from asp.net
11.Vertical Axis as the data seriesVertical Axis as the data series
12.Gradient Fills In ActionScriptGradient Fills In ActionScript
13.Setting the direction of legendsSetting the direction of legends
14.Legend with a border and title barLegend with a border and title bar
15.Name data series by using the displayName property of the series:Name data series by using the displayName property of the series:
16.Showing multiple DataTipsShowing multiple DataTips
17.Define a new callback function, dtFunc, that returns a formatted value for the DataTip:Define a new callback function, dtFunc, that returns a formatted value for the DataTip:
18.Create a custom legend in ActionScript.Create a custom legend in ActionScript.
19.Creating charts in ActionScript
20.Sets the angle property to 90, which specifies that the transition occurs from the top of the chart to the bottom.Sets the angle property to 90, which specifies that the transition occurs from the top of the chart to the bottom.
21.Use a LinearGradient class with three colors for a gradient fill of the chart's background:Use a LinearGradient class with three colors for a gradient fill of the chart's background:
22.Use fills to set the background of the chartsUse fills to set the background of the charts
23.To enable DataTips, set the value of the chart control's showDataTips property to trueTo enable DataTips, set the value of the chart control's showDataTips property to true
24.Use ColumnSet, BarSet, and AreaSet classes to combine groups of chart series,
25.Add a Legend to a chart in ActionScriptAdd a Legend to a chart in ActionScript