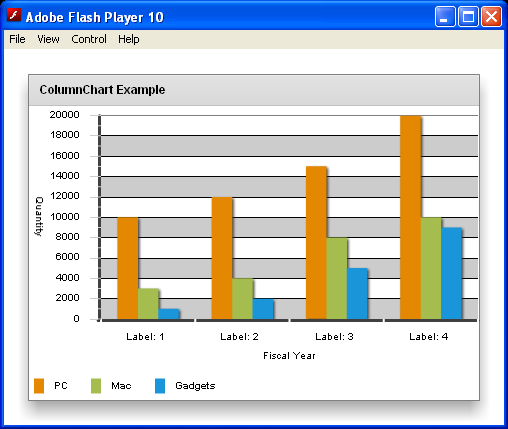
Column Chart Axis Label
<?xml version="1.0"?>
<mx:Application xmlns:mx="http://www.adobe.com/2006/mxml">
  <mx:Script>

        import mx.controls.Alert;

        import mx.collections.ArrayCollection;

        [Bindable]
        private var productSales:ArrayCollection = new ArrayCollection( [
            { Quarter: "1", PC: 10000, Mac: 3000, Gadgets: 1000, Total: 14000 },
            { Quarter: "2", PC: 12000, Mac: 4000, Gadgets: 2000, Total: 18000 },
            { Quarter: "3", PC: 15000, Mac: 8000, Gadgets: 5000, Total: 28000 },
            { Quarter: "4", PC: 20000, Mac: 10000, Gadgets: 9000, Total: 39000 }
            ]);


        public function setAxisLabel(labelValue:Object,previousLabelValue:Object,axis:CategoryAxis, labelItem:Object):String {
          return "Label: " + labelValue;
        }


  </mx:Script>
  <mx:Panel title="ColumnChart Example" width="100%" height="100%">
    <mx:ColumnChart id="columnChart" height="100%" width="100%"
      showDataTips="true" dataProvider="{productSales}">
      <mx:verticalAxis>
        <mx:LinearAxis title="Quantity" />
      </mx:verticalAxis>

      <mx:backgroundElements>
        <mx:GridLines horizontalChangeCount="1" verticalChangeCount="1">
          <mx:horizontalStroke>
            <mx:Stroke weight="1" />
          </mx:horizontalStroke>
          <mx:verticalStroke>
            <mx:Stroke weight="1" />
          </mx:verticalStroke>
          <mx:horizontalFill>
            <mx:SolidColor color="0xCCCCCC"/>
          </mx:horizontalFill>
        </mx:GridLines>
      </mx:backgroundElements>

      <mx:horizontalAxisRenderer>
        <mx:AxisRenderer>
          <mx:axisStroke>
            <mx:Stroke color="#000000" weight="3" alpha=".75" />
          </mx:axisStroke>
        </mx:AxisRenderer>
      </mx:horizontalAxisRenderer>

      <mx:verticalAxisRenderer>
        <mx:AxisRenderer>
          <mx:axisStroke>
            <mx:Stroke color="#000000" weight="3" alpha=".75" />
          </mx:axisStroke>
          <mx:tickStroke>
            <mx:Stroke color="#CCCCCC" weight="1" />
          </mx:tickStroke>
          <mx:minorTickStroke>
            <mx:Stroke color="#CCCCCC" weight="1" />
          </mx:minorTickStroke>
        </mx:AxisRenderer>
      </mx:verticalAxisRenderer>


      <mx:horizontalAxis>
        <mx:CategoryAxis dataProvider="{productSales}"
          categoryField="Quarter" labelFunction="setAxisLabel"
          title="Fiscal Year" displayName="Quarter" />
      </mx:horizontalAxis>

      <mx:series>
        <mx:ColumnSeries xField="Quarter" yField="PC" displayName="PC" />
        <mx:ColumnSeries xField="Quarter" yField="Mac" displayName="Mac" />
        <mx:ColumnSeries xField="Quarter" yField="Gadgets" displayName="Gadgets" />
      </mx:series>
    </mx:ColumnChart>

    <mx:Legend dataProvider="{columnChart}" direction="horizontal" />

  </mx:Panel>
</mx:Application>
Related examples in the same category