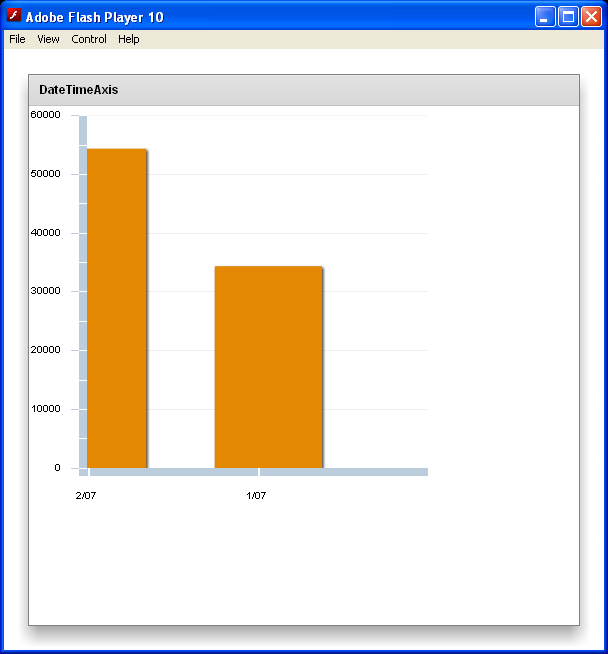
Date Time Axis Range
<!--
Code from Flex 4 Documentation "Using Adobe Flex 4".

This user guide is licensed for use under the terms of the Creative Commons Attribution
Non-Commercial 3.0 License.

This License allows users to copy, distribute, and transmit the user guide for noncommercial
purposes only so long as
  (1) proper attribution to Adobe is given as the owner of the user guide; and
  (2) any reuse or distribution of the user guide contains a notice that use of the user guide is governed by these terms.
The best way to provide notice is to include the following link.
To view a copy of this license, visit http://creativecommons.org/licenses/by-nc-sa/3.0/

-->

<mx:Application xmlns:mx="http://www.adobe.com/2006/mxml" width="600"
    height="600">
    <mx:Script>
        import mx.collections.ArrayCollection;
        // To create a Date object, you pass "YYYY,MM,DD",
        // where MM is zero-based, to the Date() constructor.
        [Bindable]
        public var minDate:Date = new Date(2006, 11, 1);
        [Bindable]
        public var maxDate:Date = new Date(2007, 1, 1);
        [Bindable] public var myData:ArrayCollection = new
            ArrayCollection([
                {date: "11/03/2006", amt: 12345},
                {date: "12/02/2006", amt: 54331},
                {date: "1/03/2007", amt: 34343},
                {date: "2/05/2007", amt: 40299}
                ]);
      </mx:Script>
    <mx:Panel title="DateTimeAxis" width="100%" height="100%">
        <mx:ColumnChart id="mychart" dataProvider="{myData}"
            showDataTips="true">
            <mx:horizontalAxis>
                <mx:DateTimeAxis dataUnits="months" minimum="{minDate}"
                    maximum="{maxDate}" />
            </mx:horizontalAxis>
            <mx:series>
                <mx:ColumnSeries yField="amt" xField="date"
                    displayName="My Data" />
            </mx:series>
        </mx:ColumnChart>
    </mx:Panel>
</mx:Application>
Related examples in the same category