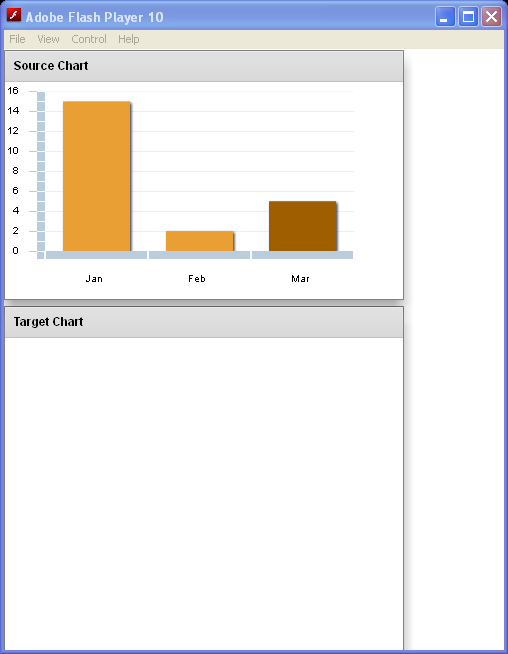
Make Chart From Drag Drop
<!--
Code from Flex 4 Documentation "Using Adobe Flex 4".

This user guide is licensed for use under the terms of the Creative Commons Attribution
Non-Commercial 3.0 License.

This License allows users to copy, distribute, and transmit the user guide for noncommercial
purposes only so long as
  (1) proper attribution to Adobe is given as the owner of the user guide; and
  (2) any reuse or distribution of the user guide contains a notice that use of the user guide is governed by these terms.
The best way to provide notice is to include the following link.
To view a copy of this license, visit http://creativecommons.org/licenses/by-nc-sa/3.0/

-->


    <!-- charts/MakeChartFromDragDrop.mxml -->
<s:Application xmlns:fx="http://ns.adobe.com/mxml/2009"
    xmlns:mx="library://ns.adobe.com/flex/mx" xmlns:s="library://ns.adobe.com/flex/spark"
    creationComplete="initApp();" height="600">
    <fx:Declarations>
        <mx:SeriesInterpolate id="interpol" duration="1000"
            elementOffset="0" minimumElementDuration="200" />
    </fx:Declarations>
    <fx:Script>

        import mx.collections.ArrayCollection;
        import mx.charts.chartClasses.ChartBase;
        import mx.charts.ChartItem;
        import mx.charts.PieChart;
        import mx.charts.series.PieSeries;
        import mx.charts.events.ChartItemEvent;
        import mx.events.DragEvent;
        import mx.controls.List;
        import mx.managers.DragManager;
        import mx.core.DragSource;
        import mx.charts.Legend;
        [Bindable]
        public var newDataProviderAC:ArrayCollection;
        [Bindable]
        private var expensesAC:ArrayCollection;

    import mx.collections.ArrayCollection;
    [Bindable]
    public var expenses:ArrayCollection = new ArrayCollection([
      {month:"Jan", profit:20, expenses:15, amount:145},
      {month:"Feb", profit:1, expenses:2, amount:60},
      {month:"Mar", profit:15, expenses:5, amount:3}
      ]);
        private function initApp():void {
            setupPieChart();
        }
        private function resultHandler():void {
            expensesAC = expenses;
        }
        private var newChart:PieChart;
        private var newSeries:PieSeries;
        [Bindable]
        private var explodedPiece:Array;
        private function explodePiece(e:Event):void {
            explodedPiece = new Array();
            explodedPiece[newSeries.selectedIndex] = .2;
            newSeries.perWedgeExplodeRadius = explodedPiece;
        }
        private function setupPieChart():void {
            newChart = new PieChart();
            newChart.showDataTips = true;
            newChart.selectionMode = "multiple";
            newChart.dropEnabled= true;
            newChart.dragEnabled= false;
            newChart.height = 350;
            newChart.width = 350;
            newChart.addEventListener("dragEnter", doDragEnter);
            newChart.addEventListener("dragDrop", doDragDrop);
            newChart.dataProvider = newDataProviderAC;
            newSeries = new PieSeries();
            newSeries.field = "expenses";
            newSeries.nameField = "month";
            newSeries.setStyle("labelPosition", "callout");
            newSeries.setStyle("showDataEffect", "interpol");
            var newSeriesArray:Array = new Array();
            newSeriesArray.push(newSeries);
            newChart.series = newSeriesArray;
            newChart.addEventListener(ChartItemEvent.CHANGE, explodePiece);
            // Create a legend for the new chart.
            var newLegend:Legend = new Legend();
            newLegend.dataProvider = newChart;
            p2.addElement(newChart);
            p2.addElement(newLegend);
        }
        private function doDragEnter(event:DragEvent):void {
            // Get a reference to the target chart.
            var dragTarget:ChartBase = ChartBase(event.currentTarget);
            // Register the target chart with the DragManager.
            DragManager.acceptDragDrop(dragTarget);
        }
        private function doDragDrop(event:DragEvent):void {
            // Get a reference to the target chart.
            var dropTarget:ChartBase=ChartBase(event.currentTarget);
            // Get the dragged items from the drag initiator. When getting
            // items from chart controls, you must use the 'chartitems'
            // format.
            var items:Array = event.dragSource.dataForFormat("chartitems") as Array;
            // Trace status messages.
            trace("length: " + String(items.length));
            trace("format: " + String(event.dragSource.formats[0]));
            // Add each item to the drop target's data provider.
            for(var i:uint=0; i < items.length; i++){
                // If the target data provider already contains the
                // item, then do nothing.
                if (dropTarget.dataProvider.contains(items[i].item)) {
                    // If the target data provider does NOT already
                    // contain the item, then add it.
                } else {
                    dropTarget.dataProvider.addItem(items[i].item);
                }
            }
        }

    </fx:Script>
    <s:layout>
        <s:VerticalLayout />
    </s:layout>
    <s:Panel id="p1" title="Source Chart" height="250" width="400">
        <s:layout>
            <s:VerticalLayout />
        </s:layout>
        <mx:ColumnChart id="myColumnChart" height="207" width="350"
            showDataTips="true" dataProvider="{expenses}"
            selectionMode="multiple" dragEnabled="true" dropEnabled="false">
            <mx:series>
                <mx:ColumnSeries id="series1" yField="expenses"
                    displayName="Expenses" selectable="true" />
            </mx:series>
            <mx:horizontalAxis>
                <mx:CategoryAxis categoryField="month" />
            </mx:horizontalAxis>
        </mx:ColumnChart>
    </s:Panel>
    <!-- This will be the parent of the soon-to-be created chart. -->
    <s:Panel id="p2" title="Target Chart" height="400" width="400">
        <s:layout>
            <s:VerticalLayout />
        </s:layout>
    </s:Panel>
</s:Application>
Related examples in the same category