Multiple Axis Chart : Column Chart « Chart « Flex


Multiple Axis Chart

Multiple Axis Chart
           
<?xml version="1.0"?>
<mx:Application xmlns:mx="http://www.adobe.com/2006/mxml"
 backgroundColor="#FFFFFF">
  <mx:Script>
    
    import mx.collections.ArrayCollection;
    [Bindable]
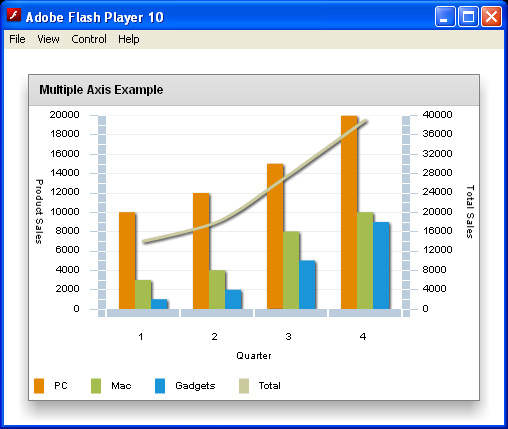
    private var productSales:ArrayCollection = new ArrayCollection( [
            { Quarter: "1", PC: 10000, Mac: 3000, Gadgets: 1000, Total: 14000 },
            { Quarter: "2", PC: 12000, Mac: 4000, Gadgets: 2000, Total: 18000 },
            { Quarter: "3", PC: 15000, Mac: 8000, Gadgets: 5000, Total: 28000 },
            { Quarter: "4", PC: 20000, Mac: 10000, Gadgets: 9000, Total: 39000 }
            ]);
  
  </mx:Script>

  <mx:Panel title="Multiple Axis Example" width="100%" height="100%" >
    <mx:ColumnChart id="columnChart" height="100%" width="100%" showDataTips="true" dataProvider="{productSales}">           
      <mx:horizontalAxis>
        <mx:CategoryAxis categoryField="Quarter" title="Quarter"/>
      </mx:horizontalAxis>          
      <mx:verticalAxis>
        <mx:LinearAxis title="Product Sales" />
      </mx:verticalAxis>
      <mx:secondVerticalAxis>
        <mx:LinearAxis title="Total Sales" />
      </mx:secondVerticalAxis> 
      <mx:series>
        <mx:ColumnSeries xField="Quarter" yField="PC" displayName="PC"/>
        <mx:ColumnSeries xField="Quarter" yField="Mac" displayName="Mac"/>
        <mx:ColumnSeries xField="Quarter" yField="Gadgets" displayName="Gadgets"/>
      </mx:series>
      <mx:secondSeries>
        <mx:LineSeries dataProvider="{productSales}" yField="Total" form="curve" displayName="Total"/>
      </mx:secondSeries>
    </mx:ColumnChart>
    <mx:Legend dataProvider="{columnChart}" direction="horizontal"/>

  </mx:Panel>
</mx:Application>


Related examples in the same category

1.PieChart vs ColumnChartPieChart vs ColumnChart
2.ColumnChart DemoColumnChart Demo
3.Waterfall Stacked ColumnChartWaterfall Stacked ColumnChart
4.Create a PieChart control from the selected columns in the ColumnChart control.Create a PieChart control from the selected columns in the ColumnChart control.
5.Column Chart Demo and CategoryAxisColumn Chart Demo and CategoryAxis
6.Combine column chart and pie chartCombine column chart and pie chart
7.Using strokes in ActionScriptUsing strokes in ActionScript
8.You can also represent the range of dates in MXML by using the following syntax:You can also represent the range of dates in MXML by using the following syntax:
9.Creating a custom Legend controlCreating a custom Legend control
10.Stack the Profit and Expenses fields, in which some of the values are negative.Stack the Profit and Expenses fields, in which some of the values are negative.
11.Add new grid lines as annotation elements to the chart and an image as the background elementAdd new grid lines as annotation elements to the chart and an image as the background element
12.Define the grid lines inside each chart control's definitionDefine the grid lines inside each chart control's definition
13.Turns on grid lines in both directions and applies them to the chart:Turns on grid lines in both directions and applies them to the chart:
14.Define set of filters, and then applies them to various chart elements:Define set of filters, and then applies them to various chart elements:
15.Mixed ChartMixed Chart
16.Display two chartsDisplay two charts
17.Define two colors and then uses those colors in the axis renderers and in the strokes and fills for the chart itemsDefine two colors and then uses those colors in the axis renderers and in the strokes and fills for the chart items
18.Make Chart From Drag DropMake Chart From Drag Drop