A rudimentary chart library : Chart « Advanced Graphics « Java
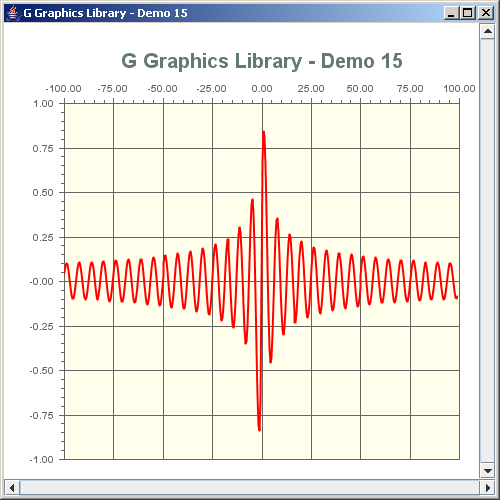
A rudimentary chart library
import java.util.Iterator;
import java.awt.*;
import java.awt.event.*;
import java.text.DecimalFormat;

import javax.swing.*;

import no.geosoft.cc.geometry.Geometry;
import no.geosoft.cc.util.NiceNumbers;
import no.geosoft.cc.util.NiceNumber;
import no.geosoft.cc.graphics.*;


/**
 * G demo program. Demonstrates:
 *
 * <ul>
 * <li>A rudimentary chart library
 * <li>The use of multiple scenes
 * <li>World extent usage
 * <li>Zooming and scrolling
 * <li><em>Nice number</em> generation
 * </ul>
 *
 * @author <a href="mailto:jacob.dreyer@geosoft.no">Jacob Dreyer</a>
 */
public class Demo15 extends JFrame
{
  /**
   * Class for creating the demo canvas and hande Swing events.
   */
  public Demo15()
  {
    super ("G Graphics Library - Demo 15");
    setDefaultCloseOperation (JFrame.EXIT_ON_CLOSE);

    // Create the GUI
    JPanel topLevel = new JPanel();
    topLevel.setLayout (new BorderLayout());
    getContentPane().add (topLevel);

    JScrollBar hScrollBar = new JScrollBar (JScrollBar.HORIZONTAL);
    getContentPane().add (hScrollBar, BorderLayout.SOUTH);

    JScrollBar vScrollBar = new JScrollBar (JScrollBar.VERTICAL);
    getContentPane().add (vScrollBar, BorderLayout.EAST);

    // Create the graphic canvas
    GWindow window = new GWindow (new Color (255, 255, 255));
    topLevel.add (window.getCanvas(), BorderLayout.CENTER);

    // Create a value set to be plotted
    ValueSet valueSet = new ValueSet();

    // Definition of exact chart location inside window
    Insets insets = new Insets (80, 60, 20, 20);

    // Create a "background" device oriented annotation scene
    GScene annotationScene = new GScene (window);
    GObject annotation = new Annotation (insets);
    annotationScene.add (annotation);

    // Create a value specific "plot" scene
    GScene plot = new Plot (window, valueSet, insets);
    annotationScene.setUserData (plot);

    pack();
    setSize (new Dimension (500, 500));
    setVisible (true);

    // Start zoom interaction
    GStyle zoomStyle = new GStyle();
    zoomStyle.setForegroundColor (new Color (0, 0, 0));
    zoomStyle.setBackgroundColor (new Color (0.8f, 1.0f, 0.8f, 0.3f));
    window.startInteraction (new ZoomInteraction (plot, zoomStyle));

    // Make sure plot can be scrolled
    plot.installScrollHandler (hScrollBar, vScrollBar);
  }


  private class Annotation extends GObject
  {
    private Insets    insets_;
    private GSegment  background_;
    private GSegment  title_;


    public Annotation (Insets insets)
    {
      insets_ = insets;

      background_ = new GSegment();
      GStyle backgroundStyle = new GStyle();
      backgroundStyle.setBackgroundColor (new Color (1.0f, 1.0f, 0.9f, 0.8f));
      background_.setStyle (backgroundStyle);
      addSegment (background_);

      title_ = new GSegment();
      GStyle titleStyle = new GStyle();
      titleStyle.setForegroundColor (new Color (100, 120, 120));
      titleStyle.setFont (new Font ("Dialog", Font.BOLD, 20));
      title_.setStyle (titleStyle);
      title_.setText (new GText ("G Graphics Library - Demo 15"));
      addSegment (title_);

      GStyle axisStyle = new GStyle();
      axisStyle.setForegroundColor (new Color (100, 100, 100));
      axisStyle.setBackgroundColor (null);
      axisStyle.setFont (new Font ("Dialog", Font.BOLD, 10));

      Axis horizontalAxis = new Axis (true, insets_);
      horizontalAxis.setStyle (axisStyle);
      add (horizontalAxis);

      Axis verticalAxis = new Axis (false, insets_);
      verticalAxis.setStyle (axisStyle);
      add (verticalAxis);
    }


    public void draw()
    {
      GViewport viewport = getScene().getViewport();

      int x0     = insets_.left;
      int y0     = insets_.top;
      int width  = viewport.getX3() - insets_.right - insets_.left + 1;
      int height = viewport.getY3() - insets_.bottom - insets_.top + 1;

      // Draw background
      background_.setGeometry (Geometry.createRectangle (x0, y0, width, height));

      // Draw title
      title_.setGeometry (x0 + width / 2, y0 / 2);
    }
  }


  /**
   * A GObject representing one axis with annotation.
   */
  private class Axis extends GObject
  {
    private Insets   insets_;
    private boolean  isTop_;


    public Axis (boolean isTop, Insets insets)
    {
      isTop_  = isTop;
      insets_ = insets;
    }


    public void draw()
    {
      removeSegments();

      // Get device coordinates
      GViewport viewport = getScene().getViewport();

      int vx0 = insets_.left;
      int vy0 = insets_.top;
      int vx1 = viewport.getX3() - insets_.right;
      int vy1 = viewport.getY3() - insets_.bottom;

      // Get annotation range
      GObject plot = (GObject) getScene().getUserData();
      if (plot == null) return;

      GWorldExtent worldExtent = plot.getScene().getWorldExtent();

      double[] w0 = worldExtent.get (0);
      double[] w1 = worldExtent.get (1);
      double[] w2 = worldExtent.get (2);

      // Prepare axis values
      double from = isTop_ ? w0[0] : w2[1];
      double to   = isTop_ ? w1[0] : w0[1];

      int x0 = vx0;
      int y0 = vy0;
      int x1 = isTop_ ? vx1 : x0;
      int y1 = isTop_ ? y0 : vy1;

      double length = Geometry.length (x0, y0, x1, y1);
      int n = (int) (length / 50.0);

      NiceNumbers niceNumbers = new NiceNumbers (from, to, n, true);

      DecimalFormat format = new DecimalFormat ("0.00");

      for (Iterator i = niceNumbers.iterator(); i.hasNext(); ) {
        NiceNumber niceNumber = (NiceNumber) i.next();

        int rank = niceNumber.getRank();
        if (rank < 2) {
          int tickLength = rank == 0 ? 5 : 3;

          GSegment tick = new GSegment();
          int tx0 = isTop_ ? x0 + (int) Math.round (niceNumber.getPosition() * (x1 - x0)) : x0 - tickLength;
          int ty0 = isTop_ ? y0 - tickLength : y0 + (int) Math.round (niceNumber.getPosition() * (y1 - y0));
          int tx1 = isTop_ ? tx0 : (rank == 0 ? vx1 : x0);
          int ty1 = isTop_ ? (rank == 0 ? vy1 : y0) : ty0;
          tick.setGeometry (tx0, ty0, tx1, ty1);

          if (rank == 0) {
            double value = niceNumber.getValue();
            GText text = new GText (format.format (value),
                                    isTop_ ? GPosition.TOP : GPosition.LEFT);
            tick.setText (text);
          }

          addSegment (tick);
        }
      }
    }
  }


  private class Curve extends GObject
  {
    private GSegment  curve_;
    private double[]  values_;


    Curve (ValueSet valueSet)
    {
      curve_ = new GSegment();
      addSegment (curve_);

      int nValues = 400;
      values_ = new double[2*nValues];

      double[] xRange = valueSet.getXRange();

      double step = (xRange[1] - xRange[0]) / nValues;
      int index = 0;
      for (int i = 0; i < nValues; i++) {
        double x = xRange[0] + i*step;
        double y = valueSet.getY (x);

        values_[index + 0] = x;
        values_[index + 1] = y;

        index+=2;
      }
    }


    public void draw()
    {
      curve_.setGeometryXy (values_);
    }
  }


  /**
   * Defines the geometry and presentation for a sample
   * graphic object.
   */
  private class Plot extends GScene
  {
    private Insets   insets_;


    Plot (GWindow window, ValueSet valueSet, Insets insets)
    {
      super (window);

      insets_ = insets;

      double[] xRange = valueSet.getXRange();
      double[] yRange = valueSet.getYRange();

      double w0[] = {xRange[0], yRange[0], 0.0};
      double w1[] = {xRange[1], yRange[0], 0.0};
      double w2[] = {xRange[0], yRange[1], 0.0};
      setWorldExtent (w0, w1, w2);

      Curve curve = new Curve (valueSet);
      GStyle curveStyle = new GStyle();
      curveStyle.setForegroundColor (new Color (255, 0, 0));
      curveStyle.setLineWidth (2);
      curve.setStyle (curveStyle);
      add (curve);
    }


    protected void resize (double dx, double dy)
    {
      super.resize (dx, dy);
      setViewport (insets_.left, insets_.top,
                   getWindow().getWidth() - insets_.left - insets_.right,
                   getWindow().getHeight() - insets_.top - insets_.bottom);
    }
  }


  private class ValueSet
  {
    public double getMin()
    {
      return 0.0;
    }


    public double[] getXRange()
    {
      return new double[] {-100.0, +100.0};
    }


    public double[] getYRange()
    {
      return new double[] {-1.0, +1.0};
    }


    public double getY (double x)
    {
      double a = Math.sqrt (Math.abs (x));
      return Math.sin (x) / (a == 0.0 ? 1.0 : a);
    }
  }


  public static void main (String[] args)
  {
    new Demo15();
  }
}
Related examples in the same category
| 1. | Chart based on Graph library | ||
| 2. | Scroll Chart | ||
| 3. | Animation Line Chart | ||
| 4. | Pie Chart | ||
| 5. | A rudimentary bar chart class | ||
| 6. | bar-graph drawable |