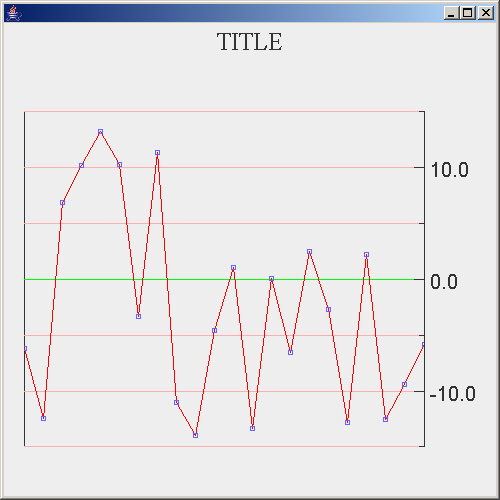
Scroll Chart
import java.awt.*;
import java.applet.*;
import java.net.URL;
import java.util.*;
import graph.*;
/*************************************************************************
**
**    Applet example2a
**                                              Version 1.0   August 1996
**
**************************************************************************
**    Copyright (C) 1996 Leigh Brookshaw
**
**    This program is free software; you can redistribute it and/or modify
**    it under the terms of the GNU General Public License as published by
**    the Free Software Foundation; either version 2 of the License, or
**    (at your option) any later version.
**
**    This program is distributed in the hope that it will be useful,
**    but WITHOUT ANY WARRANTY; without even the implied warranty of
**    MERCHANTABILITY or FITNESS FOR A PARTICULAR PURPOSE.  See the
**    GNU General Public License for more details.
**
**    You should have received a copy of the GNU General Public License
**    along with this program; if not, write to the Free Software
**    Foundation, Inc., 675 Mass Ave, Cambridge, MA 02139, USA.
**************************************************************************
**
**    This is a simple applet that creates a Scroll Chart using the
**    Graph2D class library and double buffering
**
*************************************************************************/

public class example2a extends Applet implements Runnable {

      Graph2D graph;
      Label title;
      DataSet data1 = new DataSet();

      Axis    yaxis_right;

      Image    osi = null;
      Graphics osg = null;
      int iwidth  = 0;
      int iheight = 0;

      Thread runner = null;
      Random random = new Random();
      int count = 0;


/*
**    In milliseconds how often do we want to add a new data point.
*/
      int period      = 500;
/*
**    Maximum number of points to display before scrolling the data
*/
      int maximum        = 25;
      URL markersURL;
/*
**    Initialize the applet. The Parameters passed are the title of the plot
**    the marker file to use and the update period in milliseconds
*/
      public void init() {
        int i;
        int j;

/*
**      Get the passed parameters
*/
        String st       = "TITLE";
        String mfile    = "marker.txt";
        period   = 10;
/*
**      Create the Graph instance and modify the default behaviour
*/
        graph = new Graph2D();
        graph.zerocolor = new Color(0,255,0);
        graph.borderTop    = 50;
        graph.borderBottom = 50;
        graph.setDataBackground(Color.black);
/*
**      Create the Title
*/
        title = new Label(st, Label.CENTER);
        title.setFont(new Font("TimesRoman",Font.PLAIN,25));

        setLayout( new BorderLayout() );
        add("North",  title);
        add("Center", graph);
/*
**      Load a file containing Marker definitions
*/
        try {
           markersURL = this.getClass().getResource(mfile);
           graph.setMarkers(new Markers(markersURL));
        } catch(Exception e) {
           System.out.println("Failed to create Marker URL!");
        }


/*
**      Modify the default Data behaviour
*/
        data1.linecolor   = new Color(255,0,0);
        data1.marker      = 1;
        data1.markercolor = new Color(100,100,255);
/*
**      Setup the Axis. Attach it to the Graph2D instance, and attach the data
**      to it.
*/
        yaxis_right = graph.createAxis(Axis.RIGHT);
        yaxis_right.attachDataSet(data1);
        yaxis_right.setLabelFont(new Font("Helvetica",Font.PLAIN,20));

        graph.attachDataSet(data1);


      }

      public void start() {
  if(runner == null) {
          runner = new Thread(this);
          runner.start();
        }
      }


      public void stop() {
  if(runner != null) {
          runner.stop();
          runner = null;
        }
      }


        public void run() {
              int i =0;
              double data[] = new double[2];
              Graphics g;

              while(true) {


                   count++;

                   if(count >= maximum) data1.delete(0,0);

                   data[1] = (2.0*random.nextDouble()-1.0)*50.0;
                   data[0] = count;

                   try {
                        data1.append(data,1);
          }
                   catch (Exception e) {
                        System.out.println("Error appending Data!");
                   }

                   data1.yaxis.maximum =  50.0;
                   data1.yaxis.minimum = -50.0;


                   g = graph.getGraphics();
       if( osi == null || iwidth != graph.size().width
                                   || iheight != graph.size().height  ) {
                       iwidth = graph.size().width;
                       iheight = graph.size().height;
                       osi = graph.createImage(iwidth,iheight);
                       osg = osi.getGraphics();
                   }

                   osg.setColor(this.getBackground());
                   osg.fillRect(0,0,iwidth,iheight);
                   osg.setColor(g.getColor());

                   osg.clipRect(0,0,iwidth,iheight);


                   graph.update(osg);

                   g.drawImage(osi,0,0,graph);


                   try {  Thread.sleep(period); }
                   catch(Exception e) { }

       }

  }
      public static void main(String[] a){
         javax.swing.JFrame f = new javax.swing.JFrame();
         Applet app = new example2();
         app.init();

         f.getContentPane().add (app);

         f.pack();
         f.setSize (new Dimension (500, 500));
         f.setVisible(true);
      }


}
 Graph-Scroll-Chart.zip( 198 k)
Related examples in the same category