JFreeChart: XY Area Chart Demo
/* ===========================================================
* JFreeChart : a free chart library for the Java(tm) platform
* ===========================================================
*
* (C) Copyright 2000-2004, by Object Refinery Limited and Contributors.
*
* Project Info: http://www.jfree.org/jfreechart/index.html
*
* This library is free software; you can redistribute it and/or modify it under the terms
* of the GNU Lesser General Public License as published by the Free Software Foundation;
* either version 2.1 of the License, or (at your option) any later version.
*
* This library is distributed in the hope that it will be useful, but WITHOUT ANY WARRANTY;
* without even the implied warranty of MERCHANTABILITY or FITNESS FOR A PARTICULAR PURPOSE.
* See the GNU Lesser General Public License for more details.
*
* You should have received a copy of the GNU Lesser General Public License along with this
* library; if not, write to the Free Software Foundation, Inc., 59 Temple Place, Suite 330,
* Boston, MA 02111-1307, USA.
*
* [Java is a trademark or registered trademark of Sun Microsystems, Inc.
* in the United States and other countries.]
*
* --------------------
* XYAreaChartDemo.java
* --------------------
* (C) Copyright 2002-2004, by Object Refinery Limited and Contributors.
*
* Original Author: David Gilbert (for Object Refinery Limited);
* Contributor(s): -;
*
* $Id: XYAreaChartDemo.java,v 1.8 2004/04/26 19:12:04 taqua Exp $
*
* Changes
* -------
* 03-Apr-2002 : Version 1 (DG);
* 09-Oct-2002 : Fixed errors reported by Checkstyle (DG);
* 10-Oct-2002 : Renamed AreaChartDemo --> AreaXYChartDemo (DG);
* 10-Jun-2003 : Modified to handle plot orientation (DG);
* 31-Jul-2003 : Renamed AreaXYChartDemo --> XYAreaChartDemo (DG);
*
*/
package org.jfree.chart.demo;
import java.awt.Color;
import org.jfree.chart.ChartFactory;
import org.jfree.chart.ChartPanel;
import org.jfree.chart.JFreeChart;
import org.jfree.chart.axis.ValueAxis;
import org.jfree.chart.plot.PlotOrientation;
import org.jfree.chart.plot.XYPlot;
import org.jfree.data.xy.XYDataset;
import org.jfree.data.xy.XYSeries;
import org.jfree.data.xy.XYSeriesCollection;
import org.jfree.ui.ApplicationFrame;
import org.jfree.ui.RefineryUtilities;
/**
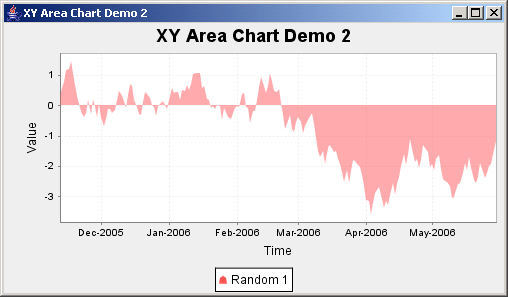
* A simple demonstration application showing how to create an area chart.
*
*/
public class XYAreaChartDemo extends ApplicationFrame {
/**
* Creates a new demo.
*
* @param title the frame title.
*/
public XYAreaChartDemo(final String title) {
super(title);
final XYSeries series1 = new XYSeries("Random 1");
series1.add(new Integer(1), new Double(500.2));
series1.add(new Integer(2), new Double(694.1));
series1.add(new Integer(3), new Double(-734.4));
series1.add(new Integer(4), new Double(453.2));
series1.add(new Integer(5), new Double(500.2));
series1.add(new Integer(6), new Double(300.7));
series1.add(new Integer(7), new Double(734.4));
series1.add(new Integer(8), new Double(453.2));
final XYSeries series2 = new XYSeries("Random 2");
series2.add(new Integer(1), new Double(700.2));
series2.add(new Integer(2), new Double(534.1));
series2.add(new Integer(3), new Double(323.4));
series2.add(new Integer(4), new Double(125.2));
series2.add(new Integer(5), new Double(653.2));
series2.add(new Integer(6), new Double(432.7));
series2.add(new Integer(7), new Double(564.4));
series2.add(new Integer(8), new Double(322.2));
final XYSeriesCollection dataset = new XYSeriesCollection(series1);
dataset.addSeries(series2);
final JFreeChart chart = createChart(dataset);
final ChartPanel chartPanel = new ChartPanel(chart);
chartPanel.setPreferredSize(new java.awt.Dimension(500, 270));
setContentPane(chartPanel);
}
/**
* Creates a chart.
*
* @param dataset the dataset.
*
* @return A chart.
*/
private JFreeChart createChart(final XYDataset dataset) {
final JFreeChart chart = ChartFactory.createXYAreaChart(
"XY Area Chart Demo",
"Domain (X)", "Range (Y)",
dataset,
PlotOrientation.VERTICAL,
true, // legend
true, // tool tips
false // URLs
);
chart.setBackgroundPaint(Color.white);
final XYPlot plot = chart.getXYPlot();
//plot.setOutlinePaint(Color.black);
plot.setBackgroundPaint(Color.lightGray);
plot.setForegroundAlpha(0.65f);
plot.setDomainGridlinePaint(Color.white);
plot.setRangeGridlinePaint(Color.white);
final ValueAxis domainAxis = plot.getDomainAxis();
domainAxis.setTickMarkPaint(Color.black);
domainAxis.setLowerMargin(0.0);
domainAxis.setUpperMargin(0.0);
final ValueAxis rangeAxis = plot.getRangeAxis();
rangeAxis.setTickMarkPaint(Color.black);
return chart;
}
// ****************************************************************************
// * JFREECHART DEVELOPER GUIDE *
// * The JFreeChart Developer Guide, written by David Gilbert, is available *
// * to purchase from Object Refinery Limited: *
// * *
// * http://www.object-refinery.com/jfreechart/guide.html *
// * *
// * Sales are used to provide funding for the JFreeChart project - please *
// * support us so that we can continue developing free software. *
// ****************************************************************************
/**
* Starting point for the demonstration application.
*
* @param args ignored.
*/
public static void main(final String[] args) {
final XYAreaChartDemo demo = new XYAreaChartDemo("XY Area Chart Demo");
demo.pack();
RefineryUtilities.centerFrameOnScreen(demo);
demo.setVisible(true);
}
}
 jfreechart-1.0.0-rc1.zip( 3,559 k)
Related examples in the same category