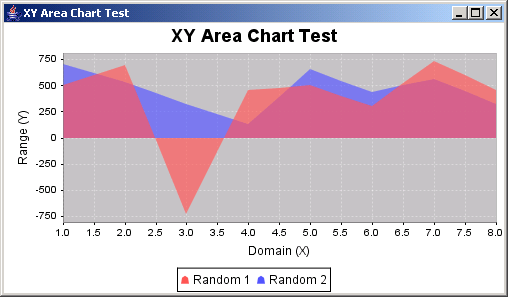
JFreeChart: XY Area Chart Demo 2
/* ===========================================================
 * JFreeChart : a free chart library for the Java(tm) platform
 * ===========================================================
 *
 * (C) Copyright 2000-2004, by Object Refinery Limited and Contributors.
 *
 * Project Info:  http://www.jfree.org/jfreechart/index.html
 *
 * This library is free software; you can redistribute it and/or modify it under the terms
 * of the GNU Lesser General Public License as published by the Free Software Foundation;
 * either version 2.1 of the License, or (at your option) any later version.
 *
 * This library is distributed in the hope that it will be useful, but WITHOUT ANY WARRANTY;
 * without even the implied warranty of MERCHANTABILITY or FITNESS FOR A PARTICULAR PURPOSE.
 * See the GNU Lesser General Public License for more details.
 *
 * You should have received a copy of the GNU Lesser General Public License along with this
 * library; if not, write to the Free Software Foundation, Inc., 59 Temple Place, Suite 330,
 * Boston, MA 02111-1307, USA.
 *
 * [Java is a trademark or registered trademark of Sun Microsystems, Inc.
 * in the United States and other countries.]
 *
 * ---------------------
 * XYAreaChartDemo2.java
 * ---------------------
 * (C) Copyright 2002-2004, by Object Refinery Limited and Contributors.
 *
 * Original Author:  David Gilbert (for Object Refinery Limited);
 * Contributor(s):   -;
 *
 * $Id: XYAreaChartDemo2.java,v 1.11 2004/05/11 14:56:17 mungady Exp $
 *
 * Changes
 * -------
 * 26-Nov-2002 : Version 1 (DG);
 *
 */

package org.jfree.chart.demo;

import java.text.DecimalFormat;
import java.text.SimpleDateFormat;

import org.jfree.chart.ChartFactory;
import org.jfree.chart.ChartPanel;
import org.jfree.chart.JFreeChart;
import org.jfree.chart.axis.DateAxis;
import org.jfree.chart.axis.ValueAxis;
import org.jfree.chart.labels.StandardXYToolTipGenerator;
import org.jfree.chart.plot.PlotOrientation;
import org.jfree.chart.plot.XYPlot;
import org.jfree.chart.renderer.xy.XYItemRenderer;
import org.jfree.data.time.Day;
import org.jfree.data.time.TimeSeries;
import org.jfree.data.time.TimeSeriesCollection;
import org.jfree.data.xy.XYDataset;
import org.jfree.ui.ApplicationFrame;
import org.jfree.ui.RefineryUtilities;

/**
 * A simple demonstration application showing how to create an area chart with a date axis for
 * the domain values.
 *
 */
public class XYAreaChartDemo2 extends ApplicationFrame {

    /**
     * Creates a new demo.
     *
     * @param title  the frame title.
     */
    public XYAreaChartDemo2(final String title) {

        super(title);

        final TimeSeries series1 = new TimeSeries("Random 1");
        double value = 0.0;
        Day day = new Day();
        for (int i = 0; i < 200; i++) {
            value = value + Math.random() - 0.5;
            series1.add(day, value);
            day = (Day) day.next();
        }

        final TimeSeriesCollection dataset = new TimeSeriesCollection(series1);

        final JFreeChart chart = createChart(dataset);

        final ChartPanel chartPanel = new ChartPanel(chart);
        chartPanel.setPreferredSize(new java.awt.Dimension(500, 270));
        setContentPane(chartPanel);

    }

    // ****************************************************************************
    // * JFREECHART DEVELOPER GUIDE                                               *
    // * The JFreeChart Developer Guide, written by David Gilbert, is available   *
    // * to purchase from Object Refinery Limited:                                *
    // *                                                                          *
    // * http://www.object-refinery.com/jfreechart/guide.html                     *
    // *                                                                          *
    // * Sales are used to provide funding for the JFreeChart project - please    *
    // * support us so that we can continue developing free software.             *
    // ****************************************************************************

    /**
     * Creates a chart.
     *
     * @param dataset  the dataset.
     *
     * @return The chart.
     */
    private JFreeChart createChart(final XYDataset dataset) {
        final JFreeChart chart = ChartFactory.createXYAreaChart(
            "XY Area Chart Demo 2",
            "Time", "Value",
            dataset,
            PlotOrientation.VERTICAL,
            true,  // legend
            true,  // tool tips
            false  // URLs
        );
        final XYPlot plot = chart.getXYPlot();

        final ValueAxis domainAxis = new DateAxis("Time");
        domainAxis.setLowerMargin(0.0);
        domainAxis.setUpperMargin(0.0);
        plot.setDomainAxis(domainAxis);
        plot.setForegroundAlpha(0.5f);

        final XYItemRenderer renderer = plot.getRenderer();
        renderer.setToolTipGenerator(
            new StandardXYToolTipGenerator(
                StandardXYToolTipGenerator.DEFAULT_TOOL_TIP_FORMAT,
                new SimpleDateFormat("d-MMM-yyyy"), new DecimalFormat("#,##0.00")
            )
        );
        return chart;
    }

    /**
     * Starting point for the demonstration application.
     *
     * @param args  ignored.
     */
    public static void main(final String[] args) {

        final XYAreaChartDemo2 demo = new XYAreaChartDemo2("XY Area Chart Demo 2");
        demo.pack();
        RefineryUtilities.centerFrameOnScreen(demo);
        demo.setVisible(true);

    }

}
 jfreechart-1.0.0-rc1.zip( 3,559 k)
Related examples in the same category