Format Line and Bar Charts : Chart Format Style « Chart « Microsoft Office Excel 2007 Tutorial
| 5.3.Chart Format Style | ||||
| 5.3.1. | Format a Chart Object | |||
| 5.3.2. | Apply a Chart Style | |||
| 5.3.3. | Apply a Chart Layout | |||
| 5.3.4. | Apply a Shape Style to a Chart Object | |||
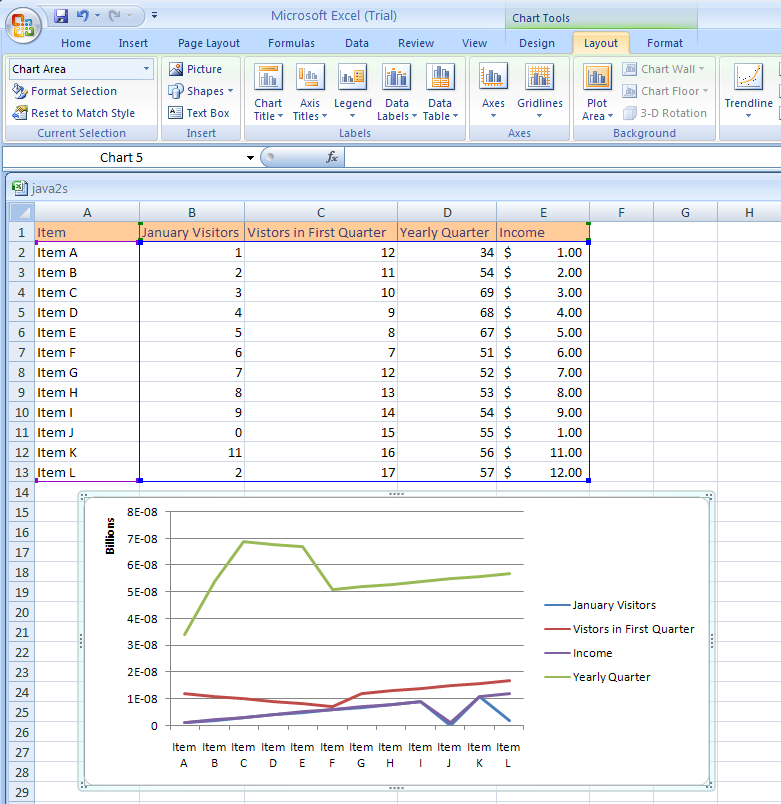
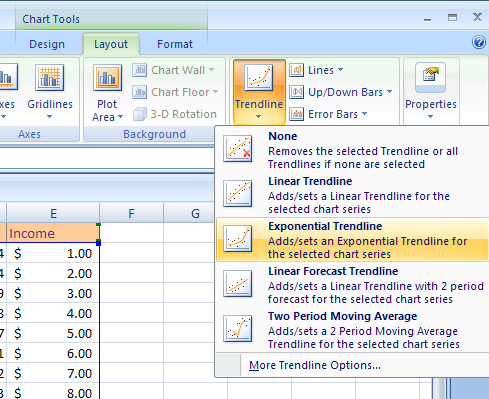
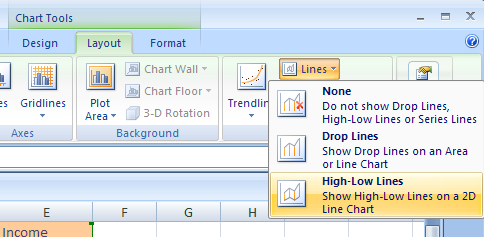
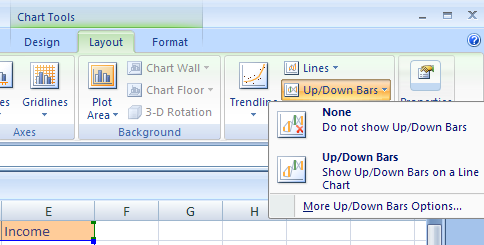
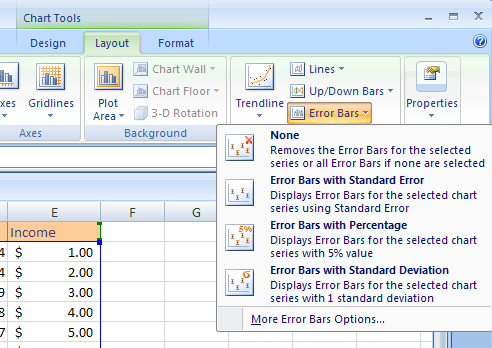
| 5.3.5. | Format Line and Bar Charts | |||
| 5.3.6. | Change the Chart Background | |||
| 5.3.7. | Format Chart Text | |||
| 5.3.8. | Insert a Picture, Shape, or Text | |||
| 5.3.9. | Reset chart formatting | |||