Set the default chart : Chart « Chart « Microsoft Office Excel 2007 Tutorial
| 5.1.Chart | ||||
| 5.1.1. | Identify the Chart | |||
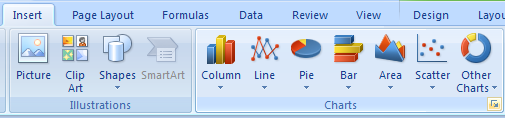
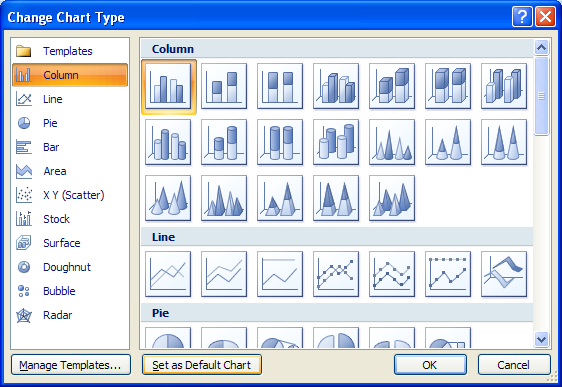
| 5.1.2. | Set the default chart | |||
| 5.1.3. | Select a Chart Element | |||
| 5.1.4. | Change a Chart Type for an Entire Chart | |||
| 5.1.5. | Convert a chart to a picture | |||