Using a Chart Template : Chart Template « Chart « Microsoft Office Excel 2007 Tutorial
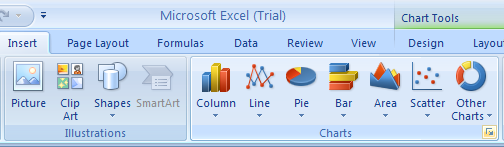
Click the Insert tab. Then click the Charts Dialog Box Launcher.
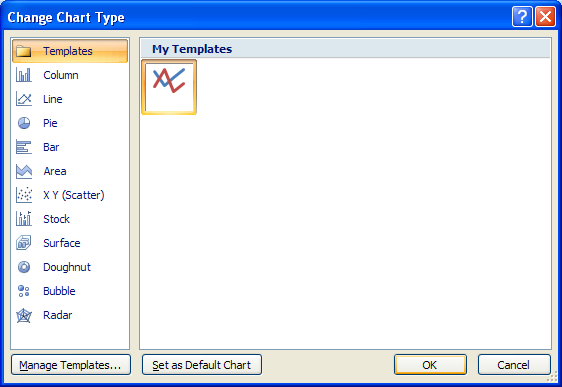
In the left pane, click Templates. Click the custom chart type.
| 5.5.Chart Template | ||||
| 5.5.1. | Create a Custom Chart Template | |||
| 5.5.2. | Using a Chart Template | |||
| 5.5.3. | Move or Delete a Custom Chart Template | |||