Create a PivotTable or PivotChart Report : PivotTable « PivotTable PivotChart « Microsoft Office Excel 2007 Tutorial

| 9.2.PivotTable | ||||
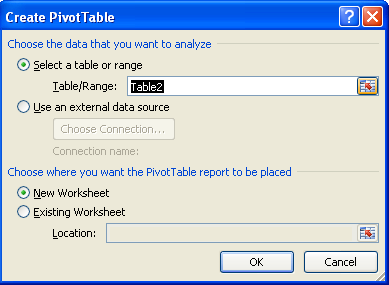
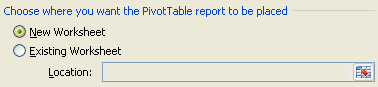
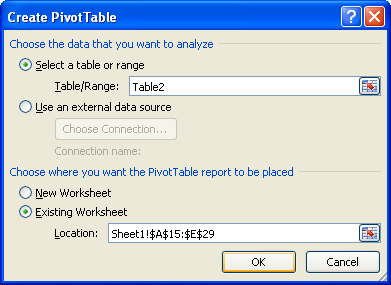
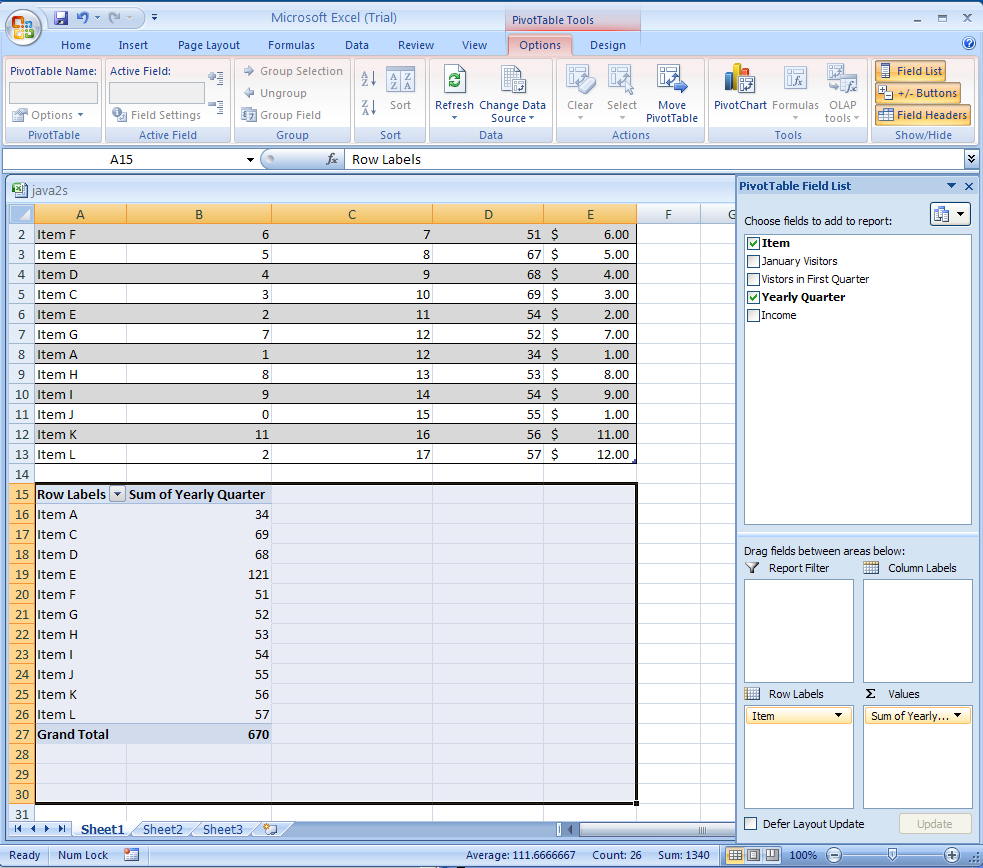
| 9.2.1. | Create a PivotTable or PivotChart Report | |||
| 9.2.2. | Delete a PivotTable. | |||
| 9.2.3. | Add or Remove a Field in a PivotTable or PivotChart Report | |||
| 9.2.4. | Modify a PivotTable Report | |||
| 9.2.5. | Format a PivotTable Report | |||
| 9.2.6. | Select a different data source for a PivotTable | |||
| 9.2.7. | Refresh PivotTable | |||
| 9.2.8. | Rename a PivotTable | |||
| 9.2.9. | Rename a field in a PivotTable | |||