' Quote from
'Visual Basic 2005 Cookbook Solutions for VB 2005 Programmers
'by Tim Patrick (Author), John Craig (Author)
'# Publisher: O'Reilly Media, Inc. (September 21, 2006)
'# Language: English
'# ISBN-10: 0596101775
'# ISBN-13: 978-0596101770
Imports System.Drawing
Imports System.Drawing.Drawing2D
Imports System.Windows.Forms
public class CustomChart
public Shared Sub Main
Application.Run(New Form1)
End Sub
End class
Public Class Form1
Private Sub Form1_Paint(ByVal sender As Object, _
ByVal e As System.Windows.Forms.PaintEventArgs) _
Handles Me.Paint
' ----- Draw a nice chart.
Dim canvas As Graphics = e.Graphics
' ----- Create an array of data points to plot.
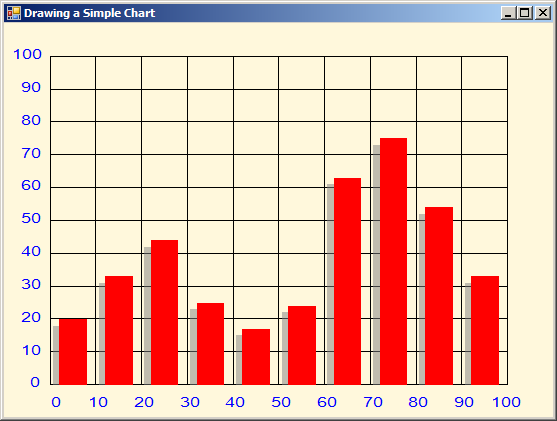
Dim chartData() As Single = _
{20, 33, 44, 25, 17, 24, 63, 75, 54, 33}
' ----- Create some pens.
Dim penRed As New Pen(Color.Red, -1)
Dim penBlack As New Pen(Color.Black, -1)
Dim penShadow As New Pen(Color.Gray, -1)
' ----- Prepare to add labels.
Dim labelFont As New Font("Arial", 3, FontStyle.Regular)
Dim labelBrush As New SolidBrush(Color.Blue)
' ----- Used to plot the various elements.
Dim x1, y1 As Single 'Lower left corner
Dim x2, y2 As Single 'Upper right corner
Dim scaleX, scaleY As Single
Dim xScan, yScan As Single
Dim oneBar As RectangleF
' ----- Set the scaling.
x1 = -10
y1 = -10
x2 = 110
y2 = 110
scaleX = Me.ClientSize.Width / (x2 - x1)
scaleY = Me.ClientSize.Height / (y2 - y1)
canvas.ScaleTransform(scaleX, -scaleY) '(inverted)
canvas.TranslateTransform(-x1, -y2) '(inverted)
' ----- Color the background.
canvas.Clear(Color.Cornsilk)
' ----- Draw chart outline rectangle.
canvas.DrawRectangle(penBlack, New Rectangle(0, 0, 100, 100))
' ----- Draw the chart grid.
For xScan = 10 To 90 Step 10
canvas.DrawLine(penBlack, xScan, 0, xScan, 100)
Next xScan
For yScan = 10 To 90 Step 10
canvas.DrawLine(penBlack, 0, yScan, 100, yScan)
Next yScan
' ----- Draw some shadowed bars.
For xScan = 0 To 90 Step 10
' ----- Draw the shadow first.
oneBar.X = xScan + 0.6
oneBar.Y = 0
oneBar.Width = 6
oneBar.Height = chartData(xScan \ 10) - 2
canvas.FillRectangle(New SolidBrush(Color.FromArgb(127, _
Color.Gray)), oneBar)
' ----- Now draw the bar in front.
oneBar.X = xScan + 2
oneBar.Y = 0
oneBar.Height = chartData(xScan \ 10)
canvas.FillRectangle(New SolidBrush(Color.Red), oneBar)
Next xScan
' ----- Need to un-invert the scaling so text labels are
' right-side-up.
canvas.ResetTransform()
canvas.ScaleTransform(scaleX, scaleY)
canvas.TranslateTransform(-x1, -y1)
' ----- Label the Y axis.
For yScan = 0 To 100 Step 10
canvas.DrawString(yScan.ToString, labelFont, labelBrush, _
-2 * yScan.ToString.Length - 3, 97 - yScan)
Next yScan
' ----- Label the X axis
For xScan = 0 To 100 Step 10
canvas.DrawString(xScan.ToString, labelFont, labelBrush, _
xScan + 1.7 - 2 * xScan.ToString.Length, 103)
Next xScan
' ----- Cleanup.
labelFont.Dispose()
labelBrush.Dispose()
penRed.Dispose()
penBlack.Dispose()
penShadow.Dispose()
canvas = Nothing
End Sub
Private Sub Form1_Resize(ByVal sender As Object, ByVal e As System.EventArgs) Handles Me.Resize
' ----- Refresh on resize.
Me.Refresh()
End Sub
End Class
<Global.Microsoft.VisualBasic.CompilerServices.DesignerGenerated()> _
Partial Class Form1
Inherits System.Windows.Forms.Form
'Form overrides dispose to clean up the component list.
<System.Diagnostics.DebuggerNonUserCode()> _
Protected Overrides Sub Dispose(ByVal disposing As Boolean)
If disposing AndAlso components IsNot Nothing Then
components.Dispose()
End If
MyBase.Dispose(disposing)
End Sub
'Required by the Windows Form Designer
Private components As System.ComponentModel.IContainer
'NOTE: The following procedure is required by the Windows Form Designer
'It can be modified using the Windows Form Designer.
'Do not modify it using the code editor.
<System.Diagnostics.DebuggerStepThrough()> _
Private Sub InitializeComponent()
Me.SuspendLayout()
'
'Form1
'
Me.AutoScaleDimensions = New System.Drawing.SizeF(6.0!, 13.0!)
Me.AutoScaleMode = System.Windows.Forms.AutoScaleMode.Font
Me.ClientSize = New System.Drawing.Size(549, 394)
Me.DoubleBuffered = True
Me.Name = "Form1"
Me.Text = "Drawing a Simple Chart"
Me.ResumeLayout(False)
End Sub
End Class