Insert and Create a Chart : Chart « Chart Table « Microsoft Office PowerPoint 2007 Tutorial
| 4.1.Chart | ||||
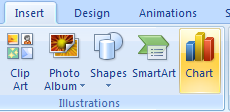
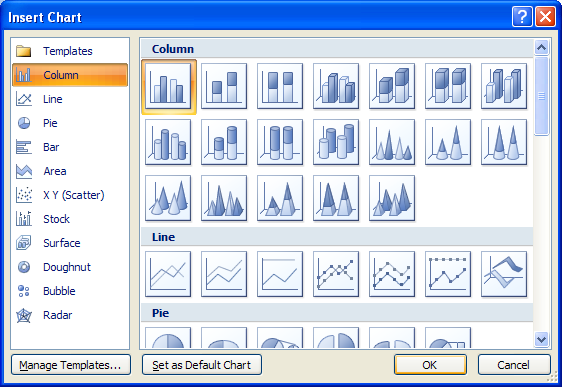
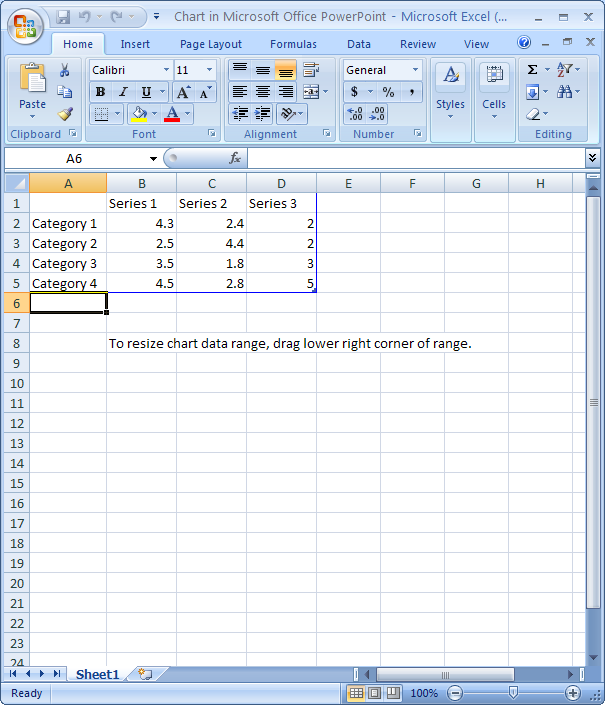
| 4.1.1. | Insert and Create a Chart | |||
| 4.1.2. | Open and View Chart Data | |||
| 4.1.3. | Create a chart from a slide layout | |||
| 4.1.4. | Change a Chart Type | |||
| 4.1.5. | Reset chart formatting | |||
| 4.1.6. | Apply a Chart Layout | |||
| 4.1.7. | Apply a Chart Style | |||
| 4.1.8. | Select a Chart Object | |||
| 4.1.9. | Change a Chart Object Style | |||
| 4.1.10. | Apply a Shape Styles to a Chart Object | |||
| 4.1.11. | Change Chart Labels | |||
| 4.1.12. | Insert a picture into a chart | |||
| 4.1.13. | Insert a shape into a chart | |||
| 4.1.14. | Change Chart Axis | |||
| 4.1.15. | Change Chart Background | |||
| 4.1.16. | Create a Custom Chart Template | |||
| 4.1.17. | Apply a Chart Template | |||
| 4.1.18. | Animate Chart Elements | |||