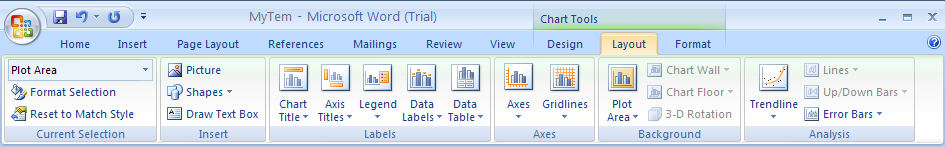
Select the chart
Click the Layout tab under Chart Tools.
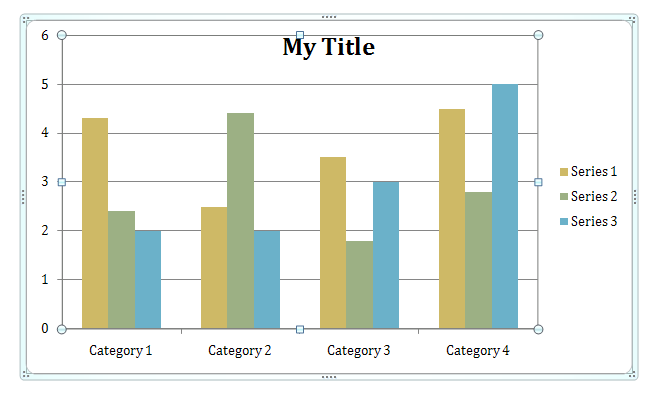
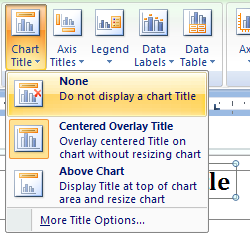
Click the Chart Title.
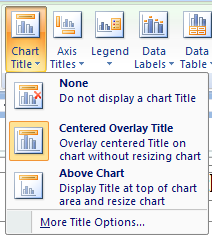
Then click to add, remove, or position a chart title.
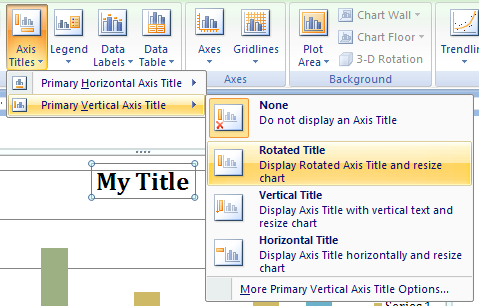
Click Axis Titles.
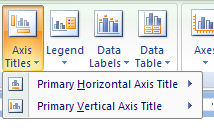
Then click to add or remove an axis title on the chart.
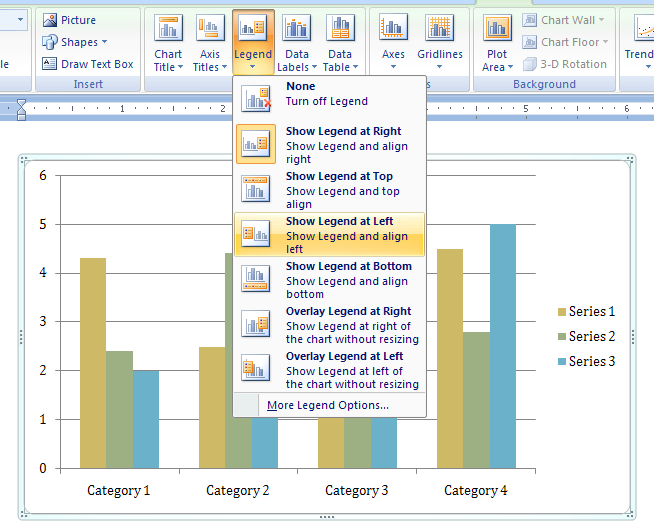
Click Legend.
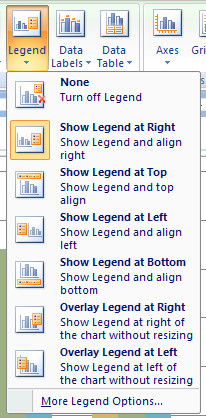
Then click to select a legend position on the chart.
Click Data Labels.
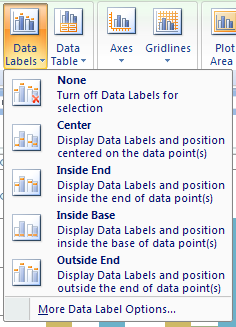
Then click to show or hide data labels on the chart for each data series.

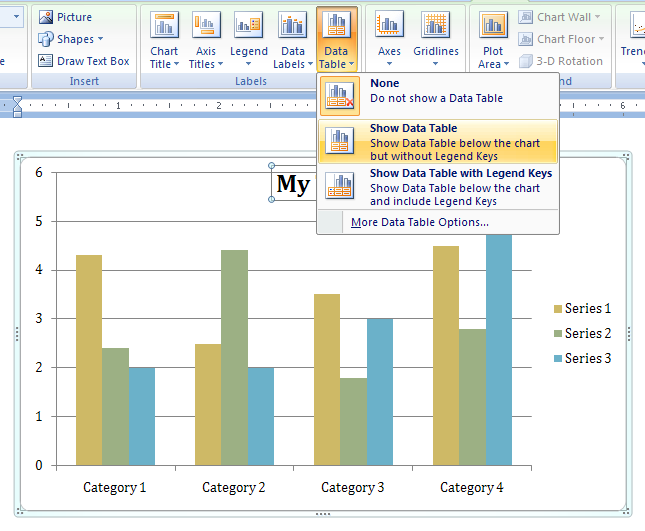
Click Data Table.

Then click to show or hide a table next to the chart with the chart data.
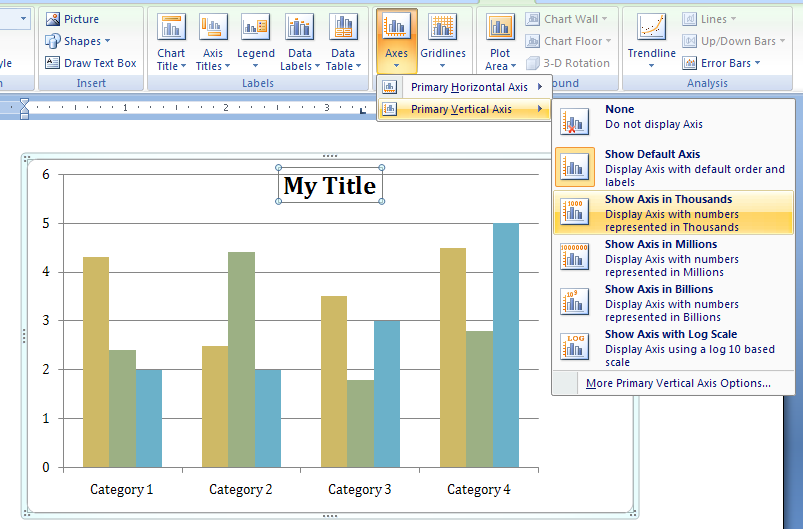
Click Axes
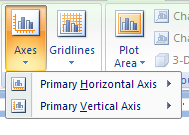
Then click to show, hide, or position axis labels or tick marks.
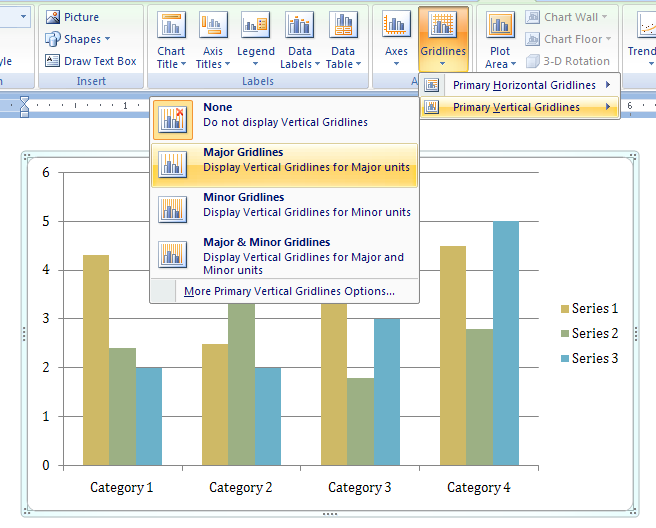
Click Gridlines
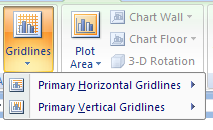
Then click to show or hide major or minor gridlines.