Edit the Data Source : Chart Properties « Chart « Microsoft Office Word 2007 Tutorial


Click the chart
Click the chart
Click the Design tab under Chart Tools.
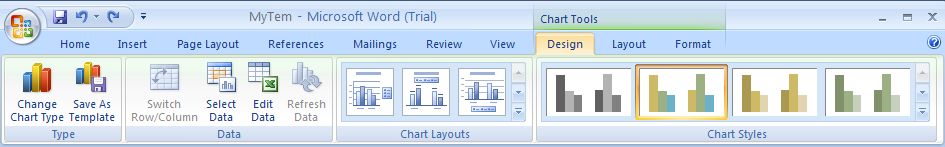
Click the Select Data button on the Design tab under Chart Tools.
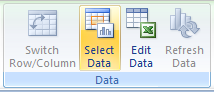
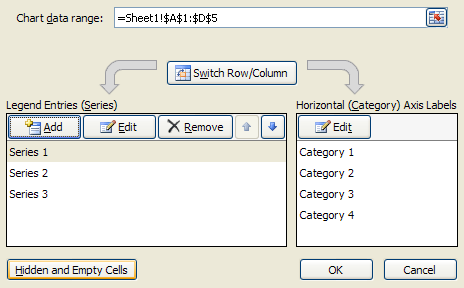
Chart data range displays the data range of the plotted chart.
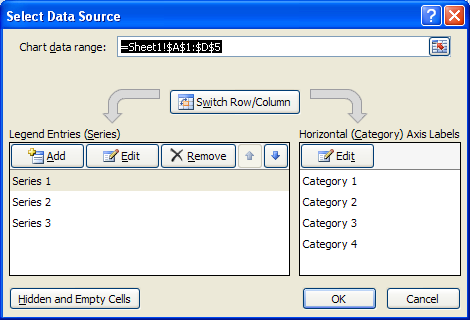
Switch Row/Column set plotting the data series from rows or columns.
Click 'Edit' to make changes to a Legend or Horizontal series.
Click 'Remove' to remove the selected Legend data series.
Click 'Move Up and Move Down' to move a Legend data series up or down in the list.
Click 'Hidden and Empty Cells' to plot hidden data and set what to do with empty cells.


7.2.Chart Properties
7.2.1.Change a Chart Layout or StyleChange a Chart Layout or Style
7.2.2.Change Chart TitleChange Chart Title
7.2.3.Change the Chart Legend, Data Labels, and Axis TitlesChange the Chart Legend, Data Labels, and Axis Titles
7.2.4.Format Line and Bar ChartsFormat Line and Bar Charts
7.2.5.Edit the Data SourceEdit the Data Source