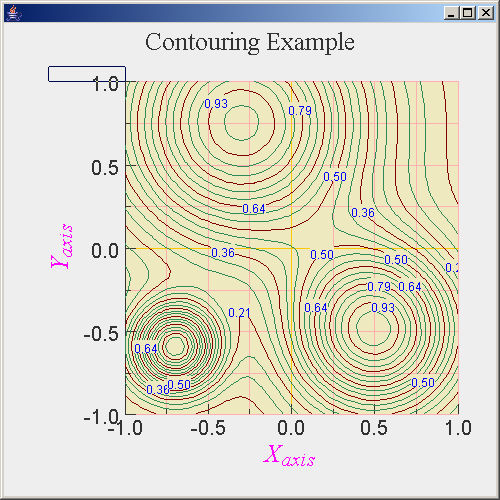
Contouring
import java.awt.*;
import java.applet.*;
import java.net.URL;
import java.util.*;
import graph.*;
/*************************************************************************
**
**    Applet example6
**                                              Version 1.0   February 1996
**
**************************************************************************
**    Copyright (C) 1996 Leigh Brookshaw
**
**    This program is free software; you can redistribute it and/or modify
**    it under the terms of the GNU General Public License as published by
**    the Free Software Foundation; either version 2 of the License, or
**    (at your option) any later version.
**
**    This program is distributed in the hope that it will be useful,
**    but WITHOUT ANY WARRANTY; without even the implied warranty of
**    MERCHANTABILITY or FITNESS FOR A PARTICULAR PURPOSE.  See the
**    GNU General Public License for more details.
**
**    You should have received a copy of the GNU General Public License
**    along with this program; if not, write to the Free Software
**    Foundation, Inc., 675 Mass Ave, Cambridge, MA 02139, USA.
**************************************************************************
**
**    This applet demonstrates the the contouring cababilities
**    of the Contour class
**
*************************************************************************/

public class example6 extends Applet {

      LoadData dynamic;
      Contour graph;
      Label title;
      Axis    xaxis;
      Axis    yaxis;


      public void init() {
        int i;
        int j;

/*
**      Instantiate the Contour class and calculate the data
*/
        graph = new Contour();
        graph.setDataBackground(new Color(0.933f,0.914f,0.749f));
        graph.setContourColor(new Color(0.180f,0.545f,0.341f));
        graph.setLabelledContourColor(new Color(0.5f,.0f,0.0f));

        graph.setLabelPrecision(2);
        graph.setLabelSignificance(2);


//        this.showStatus("Creating Data to Contour!");

        createGrid(graph);

        graph.square       = true;
/*
**      Build the title and place it at the top of the graph
*/
        graph.setFont(new Font("TimesRoman",Font.PLAIN,25));
        title = new Label("Contouring Example", Label.CENTER);
        title.setFont(new Font("TimesRoman",Font.PLAIN,25));

        setLayout( new BorderLayout() );
        add("North",  title);
        add("Center", graph);
/*
**      Instantiate the xaxis and attach the dataset.
*/
        xaxis = graph.createXAxis();
        xaxis.setTitleText("X_axis");
        xaxis.setTitleColor(Color.magenta);
        xaxis.setTitleFont(new Font("TimesRoman",Font.ITALIC,25));
        xaxis.setLabelFont(new Font("Helvetica",Font.PLAIN,20));


/*
**      Instantiate the yaxis and attach the dataset.
*/
        yaxis = graph.createYAxis();
        yaxis.setTitleText("Y_axis");
        yaxis.setTitleColor(Color.magenta);
        yaxis.setTitleFont(new Font("TimesRoman",Font.ITALIC,25));
        yaxis.setLabelFont(new Font("Helvetica",Font.PLAIN,20));


      }


      public void createGrid(Contour graph) {
         int i,j;
         int count;

         int nx = 50;
         int ny = 50;

         double xmin = -1.0;
         double xmax =  1.0;
         double ymax =  1.0;
         double ymin = -1.0;


         double array[] = new double[nx*ny];
         double x, y, rad;

         double h1, h2, h3;

         h1 = 0.5*0.5;

         h2 = 0.75*0.75;

         h3 = 0.25*0.25;

         count = 0;

         for(j=0; j<ny; j++) {

             y = 2.0*(double)j/(double)(ny-1) - 1.0;

             for(i=0; i<nx; i++) {
                x = 2.0*(double)i/(double)(nx-1) - 1.0;

                rad = (x-0.5)*(x-0.5) + (y+0.5)*(y+0.5);
                array[count] = Math.exp( -rad/h1 );

                rad = (x+0.3)*(x+0.3) + (y-0.75)*(y-0.75);
                array[count] += Math.exp( -rad/h2 );

                rad = (x+0.7)*(x+0.7) + (y+0.6)*(y+0.6);
                array[count] += Math.exp( -rad/h3 );


                count++;
        }
     }

           graph.setGrid(array,nx,ny);
           graph.setRange(xmin,xmax,ymin,ymax);
           graph.setLimitsToGrid(true);
           graph.setLabelLevels(3);
           graph.setNLevels(20);
      }
      public static void main(String[] a){
         javax.swing.JFrame f = new javax.swing.JFrame();
         Applet app = new example6();
         app.init();

         f.getContentPane().add (app);

         f.pack();
         f.setSize (new Dimension (500, 500));
         f.setVisible(true);
      }
}
 Graph-Contouring.zip( 233 k)
Related examples in the same category