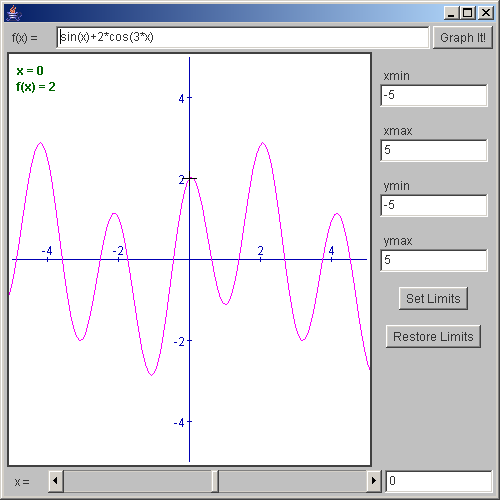
Draw math function on the coordinate
/*************************************************************************
*                                                                        *
*  This source code file, and compiled classes derived from it, can      *
*  be used and distributed without restriction, including for commercial *
*  use.  (Attribution is not required but is appreciated.)               *
*                                                                        *
*   David J. Eck                                                         *
*   Department of Mathematics and Computer Science                       *
*   Hobart and William Smith Colleges                                    *
*   Geneva, New York 14456,   USA                                        *
*   Email: eck@hws.edu          WWW: http://math.hws.edu/eck/            *
*                                                                        *
*************************************************************************/

import java.awt.*;
import edu.hws.jcm.data.*;
import edu.hws.jcm.draw.*;
import edu.hws.jcm.awt.*;

public class GraphApplet2 extends java.applet.Applet {
      public static void main(String[] a){
         javax.swing.JFrame f = new javax.swing.JFrame();
         java.applet.Applet app = new GraphApplet2();
         app.init();

         f.getContentPane().add (app);

         f.pack();
         f.setSize (new Dimension (500, 500));
         f.setVisible(true);
      }
   private DisplayCanvas canvas;

   public void stop() {
         // To be a little nicer to the system, I have declared the DisplayCanvas
         // outside the init() method, and I use the standard stop() method of
         // the applet to call canvas.releaseResources().  This frees up the
         // substantial amount of memory that is used for the off-screen copy
         // of image displayed on the canvas.  (This off-screen copy is used for
         // "double-buffering".)
      canvas.releaseResources();
   }


   public void init() {

      Parser parser = new Parser();      // Create the parser and the variable, x.
      Variable x = new Variable("x");
      parser.add(x);

      canvas = new DisplayCanvas();      // Create the canvas, and set it to do zooming.
      canvas.setHandleMouseZooms(true);

      canvas.add(new Panner());  // Adding a panner lets the user right-click-and-drag on the
                                 // canvas to slide the graph around.

      CoordinateRect coords = canvas.getCoordinateRect();
          // Behind the scene, a canvas has a CoordinateRect, which actually keeps track
          //   of the x- and y-limits (and does some of the other work of the canvas).
          //   For some purposes, you need the CoordinateRect.  You can obtain it by
          //   calling the DisplayCanvas's getCoordinateRect() method.

      LimitControlPanel limits =
           new LimitControlPanel( LimitControlPanel.SET_LIMITS | LimitControlPanel.RESTORE, false);
             // In this case, I am using a LimitControlPanel that contains two buttons.
             //   the usual "Set Limits" button and a "Restore Limits" button.  The second button
             //   button will restore the original limits on the canvas.  The second parameter
             //   to this constructor can be set to true if you would like the components in the
             //   LimitControlPanel to be arranged into two columns instead of one.
             //   Buttons can also be added after the constructor is called by calling
             //   the addButtons() method from class LimitControlPanel.

      limits.addCoords(canvas);

      ExpressionInput input = new ExpressionInput("sin(x)+2*cos(3*x)", parser);  // For user input
      Function func = input.getFunction(x);  // The function that will be graphed.
      Graph1D graph = new Graph1D(func);     // The graph itself.

      VariableInput xInput = new VariableInput();  // An input box where the user can
                                                   //   specify the x-coordinate of the
                                                   //   point on the graph that is marked
                                                   //   by the crosshair.

      VariableSlider xSlider = new VariableSlider( coords.getValueObject(CoordinateRect.XMIN),
                                            coords.getValueObject(CoordinateRect.XMAX) );
          // A VariableSlider is a slider (actually a Scrollbar) that the user can
          //   adjust as a means of inputting a value.  The parameters to the constructor
          //   specify the minimum and maximum of this value.  In this case, the minimum
          //   value is coords.getValueObject(CoordinateRect.XMIN).  This says that the
          //   minimum value on the slider is given by the minimum x-value on the canvas's
          //   CoordinateRect.  This minimum is adjusted automatically when the limits
          //   on the CoordinateRect change.  The maximum value is similar.
          // This Variable Slider is actually used as a second way of inputting the
          //   x-coordinate of the point where the crosshair is shown.  Later, the value of
          //   the slider will be "tied" to the value in the VariableInput.  You should check
          //   that when you change one, the other is also changed.  (To change the
          //   value associated with the VariableInput box, you have to press return
          //   in that box.)

      DrawString info = new DrawString("x = #\nf(x) = #", DrawString.TOP_LEFT,
                                   new Value[] { xSlider, new ValueMath(func,xSlider) });
          // A DrawString draws a string on a DisplayCanvas.  The string can have line
          //   breaks, indicated by '\n', and can contain embedded Values, indicated
          //   by '#'.  The position of the string is DrawString.TOP_LEFT.  That is,
          //   it is in the top-left corner of the canvas.  The third parameter is
          //   an array of Value objects whose values are substituted for the #'s
          //   in the string.

      info.setFont( new Font("SansSerif",Font.BOLD,12) );  // Set properties of the DrawString.
      info.setColor( new Color(0,100,0) );
      info.setOffset(10);

      ComputeButton graphIt = new ComputeButton("Graph It!");
          // A ComputeButton is just a button that can be registered with a Controller,
          //   so that clicking on the Button causes the Controller to compute.  In this
          //   case, this is a redundant input, since pressing return in the ExpressionInput
          //   box will accomplish the same thing.  However, the button gives the user
          //   a more obvious way to change the function that is graphed.

      JCMPanel main = new JCMPanel();         // The interface is constructed of JCMPanels.
      JCMPanel top = new JCMPanel();
      JCMPanel bottom = new JCMPanel();
      main.add(canvas, BorderLayout.CENTER);
      main.add(limits, BorderLayout.EAST);
      main.add(bottom, BorderLayout.SOUTH);
      main.add(top, BorderLayout.NORTH);
      main.setInsetGap(3);

      top.add(input, BorderLayout.CENTER);
      top.add(new Label(" f(x) = "), BorderLayout.WEST);
      top.add(graphIt, BorderLayout.EAST);

      bottom.add(xSlider, BorderLayout.CENTER);
      bottom.add(xInput, BorderLayout.EAST);
      bottom.add(new Label("  x = "), BorderLayout.WEST);

      setLayout(new BorderLayout());   // Set up for the Applet itself.
      add(main, BorderLayout.CENTER);
      setBackground(Color.lightGray);

      canvas.add( new Axes() );  // Add a set of axes to the DisplayCanvas.

      canvas.add(graph);         // Add the graph of the function to the DisplayCanvas.

      canvas.add( new Crosshair(xSlider, func) );  // Add a CrossHair to the canvas.
                                                   //   The crosshair is on the graph of the
                                                   //   function, func, at the point whose xCoordinate
                                                   //   is given by the value on the slider, xSlider.

      canvas.add( info );  // Add the DrawString to the canvas.

      canvas.add( new DrawBorder(Color.darkGray, 2) );  // Add a 2-pixel dark gray border around
                                                        //   edges of the canvas.


      main.gatherInputs();  // The Controller for the main panel.
                            //    must be set to respond to user actions
                            //    on the input objects.  The gatherInputs()
                            //    method is an easy way to do this.  This calls
                            //    the setOnUserAction() method of the four
                            //    input objects:  input, graphIt, xInput
                            //    and xSlider.

      Controller controller = main.getController();  // Get the controller from the main panel.
                                                     // We still need it for a few things...

      graphIt.setOnUserAction(controller);  // ComputeButtons aren't handled automatically
                                            //   by main.gatherInput().  It must be set
                                            //   to notify the controller when it is clicked,
                                            //   in order for the applet to be recomputed
                                            //   when the button is clicked.

      coords.setOnChange(controller);   // Because the VariableSlider depends on the limits
                                        //   on the CoordinateRect, the controller must also
                                        //   listen for changes in these limits.  The gatherInputs()
                                        //   doesn't "gather" in the coordinate rect.

      controller.add( new Tie(xSlider,xInput) );  // This is the thing that synchronizes the
                                                  //   values on the VariableSlider and the
                                                  //   VariableSlider.  After checking all the
                                                  //   inputs in the applet, the Controller
                                                  //   "synchronizes" the two objects named
                                                  //   in the "Tie".

      // I forgot to set an errorReporter for this applet!
      // You can check what happens when the input in the applet
      // contains an error. (The error message is printed to
      // standard output.  In Netscape, for example, this means
      // that it goes to the Java Console, where it will do the
      // user no good at all.)

   }  // end init()

} // end class SimpleGraph
 jcm1-source.zip( 532 k)
Related examples in the same category