Derivatives
/*************************************************************************
* *
* This source code file, and compiled classes derived from it, can *
* be used and distributed without restriction, including for commercial *
* use. (Attribution is not required but is appreciated.) *
* *
* David J. Eck *
* Department of Mathematics and Computer Science *
* Hobart and William Smith Colleges *
* Geneva, New York 14456, USA *
* Email: eck@hws.edu WWW: http://math.hws.edu/eck/ *
* *
*************************************************************************/
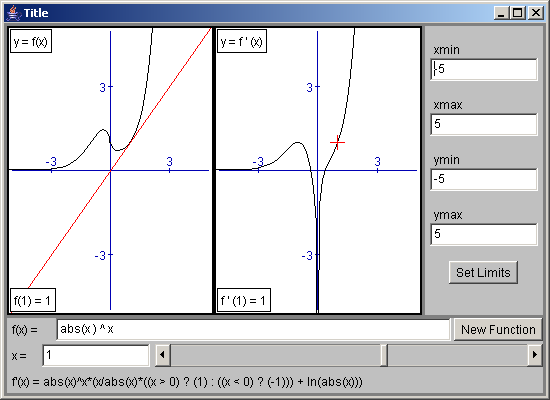
// Draws the graph of a function and its first derivative (and optionally
// its second derivative). It shows the tangent line to the graph and
// marks the corresponding point on the graph of the derivative. The
// user controls the position of the tangent line with a slider and/or
// a number-input box. A formula for the derivative can be displayed
// at the bototm of the applet.
import java.awt.*;
import java.awt.event.*;
import java.applet.Applet;
import java.util.StringTokenizer;
import edu.hws.jcm.draw.*;
import edu.hws.jcm.data.*;
import edu.hws.jcm.functions.*;
import edu.hws.jcm.awt.*;
public class Derivatives extends GenericGraphApplet {
private String functionName; // name of the fuction beging graphed, 'f' by default; used in labels etc
private Function func; // The function that is graphed.
private Function deriv; // derivative of func
private Expression derivExpression; // The Expression that defines the derivative
private Function deriv2; // if non-null, second derivative of func
private Controller subController = new Controller(); // Respond to changes in x-coord input; won't redraw graph
private VariableInput xInput; // x-coord of point of tangency
private class ExprLbl extends Label implements Computable {
// A class for displaying the formula for deriv
String label;
ExprLbl(String label) {
this.label = label;
compute();
}
public void compute() {
setText(label + derivExpression.toString());
}
}
protected void setUpParameterDefaults() { // I don't want to use abs(x)^x as the default function, since it's derivative is so funny
parameterDefaults = new java.util.Hashtable();
parameterDefaults.put("Function", " tan(" + getParameter("Variable","x") + ")");
}
protected void setUpMainPanel() { // add a bunch of extra components at the end
super.setUpMainPanel();
// now that limitsPanel has been set up, add the two extra coordinate rects to it
if (limitsPanel != null) {
limitsPanel.addCoords(canvas.getCoordinateRect(1));
if (deriv2 != null)
limitsPanel.addCoords(canvas.getCoordinateRect(2));
}
else { // CoordinateRects must synchronize with each other
Tie coordTie = new Tie(canvas.getCoordinateRect(0),canvas.getCoordinateRect(1));
if (deriv2 != null)
coordTie.add(canvas.getCoordinateRect(2));
canvas.getCoordinateRect(0).setSyncWith(coordTie);
canvas.getCoordinateRect(1).setSyncWith(coordTie);
if (deriv2 != null)
canvas.getCoordinateRect(2).setSyncWith(coordTie);
}
// Add controls at the bottom of the panel for setting the value of x.
// Also add the derivative formula, if it's supposed to be displayed
Value xMin = canvas.getCoordinateRect().getValueObject(CoordinateRect.XMIN);
Value xMax = canvas.getCoordinateRect().getValueObject(CoordinateRect.XMAX);
canvas.getCoordinateRect().setOnChange(subController);
VariableSlider xSlider = new VariableSlider(xMin,xMax);
xSlider.setOnUserAction(subController);
xInput.setOnTextChange(subController);
subController.add(xSlider);
subController.add(xInput);
subController.add( new Tie(xSlider,xInput) );
Panel p = new Panel();
p.setLayout(new BorderLayout(5,5));
p.add(xInput.withLabel(), BorderLayout.WEST);
p.add(xSlider, BorderLayout.CENTER);
// If there is no limits panel, make it possible to add a RestoreLimits button to the input panel
if (limitsPanel == null && ! "no".equalsIgnoreCase(getParameter("UseRestoreButton","no"))) {
// add button to left of slider
Button res = new Button("Restore Limits");
p.add(res, BorderLayout.EAST);
res.setBackground(Color.lightGray);
res.addActionListener( new ActionListener() {
public void actionPerformed(ActionEvent evt) {
canvas.getCoordinateRect(0).restore();
canvas.getCoordinateRect(1).restore();
if (deriv2 != null)
canvas.getCoordinateRect(2).restore();
}
});
}
if ("yes".equalsIgnoreCase(getParameter("ShowFormula", "yes"))) { // add derivative formula
Panel s = new Panel();
s.setLayout(new GridLayout(2,1,3,3));
s.add(p);
ExprLbl lbl = new ExprLbl(" " + functionName + "'(" + xVar.getName() + ") = ");
mainController.add(lbl);
s.add(lbl);
p = s;
}
if (inputPanel == null) {
// Add the control panel directly to the main panel
p.setBackground(getColorParam("PanelBackground",Color.lightGray));
mainPanel.add(p,BorderLayout.SOUTH);
}
else {
// Add control panel to bottom of input panel.
inputPanel.add(p,BorderLayout.SOUTH);
}
} // end setUpMainPanel
protected void setUpCanvas() { // Override this to add more stuff to the canvas.
// I don't call super.setUpCanvas(), since
// the canvas in this case is quite a bit different
// from the standard one.
boolean showSecond = ! "no".equalsIgnoreCase(getParameter("SecondDerivative","no"));
xInput = new VariableInput(xVar.getName(), getParameter("X","1"));
if (functionInput != null) {
func = functionInput.getFunction(xVar);
derivExpression = functionInput.getExpression().derivative(xVar);
}
else {
String def = getParameter("Function");
Expression exp = parser.parse(def);
Function f = new SimpleFunction( exp, xVar );
derivExpression = exp.derivative(xVar);
func = new WrapperFunction(f);
}
Graph1D graph = new Graph1D(func);
Color color = getColorParam("GraphColor",Color.black);
graph.setColor(color);
deriv = func.derivative(1);
Graph1D derivGraph = new Graph1D(deriv);
derivGraph.setColor(color);
Graph1D deriv2Graph = null;
if (showSecond) {
deriv2 = deriv.derivative(1);
deriv2Graph = new Graph1D(deriv2);
deriv2Graph.setColor(color);
}
// Set up 2 or 3 coordinate retcs
if (showSecond) {
canvas.addNewCoordinateRect(0, 1.0/3.0, 0, 1);
canvas.addNewCoordinateRect(1.0/3.0, 2.0/3.0, 0, 1);
canvas.addNewCoordinateRect(2.0/3.0, 1, 0, 1);
}
else {
canvas.addNewCoordinateRect(0, 0.5, 0, 1);
canvas.addNewCoordinateRect(0.5, 1, 0, 1);
}
// do the type of stuff that's usually done in super.setUpCanvas
color = getColorParam("CanvasColor");
if (color != null)
canvas.setBackground(color);
if (! "no".equalsIgnoreCase(getParameter("UsePanner", "no")) ) {
canvas.add(new Panner(),0);
canvas.add(new Panner(),1);
if (showSecond)
canvas.add(new Panner(),2);
}
if ( ! "no".equalsIgnoreCase(getParameter("UseGrid", "no")) ) {
Grid g = new Grid();
color = getColorParam("GridColor");
if (color != null)
g.setColor(color);
canvas.add(g,0);
g = new Grid();
color = getColorParam("GridColor");
if (color != null)
g.setColor(color);
canvas.add(g,1);
if (showSecond) {
g = new Grid();
color = getColorParam("GridColor");
if (color != null)
g.setColor(color);
canvas.add(g,2);
}
}
canvas.add(makeAxes(),0);
canvas.add(makeAxes(),1);
if (showSecond)
canvas.add(makeAxes(),2);
if ( ! "no".equalsIgnoreCase(getParameter("UseMouseZoom", "no")) )
canvas.setHandleMouseZooms(true);
if ( "yes".equalsIgnoreCase(getParameter("UseOffscreenCanvas", "yes")) )
canvas.setUseOffscreenCanvas(true);
mainController.setErrorReporter(canvas);
mainPanel.add(canvas, BorderLayout.CENTER);
// add graphs, tangent lines etc.
canvas.add(graph,0);
canvas.add(derivGraph,1);
if (showSecond)
canvas.add(deriv2Graph,2);
Color tangentColor = getColorParam("TangentColor", Color.red);
Color tangentColor2 = getColorParam("TangentColor2", new Color(0, 180, 0));
mainController.remove(canvas);
mainController.add(graph);
mainController.add(derivGraph);
if (showSecond)
mainController.add(deriv2Graph);
subController = new Controller();
mainController.add(subController);
TangentLine tan = new TangentLine(xInput, func);
Crosshair cross = new Crosshair(xInput,deriv);
tan.setColor(tangentColor);
cross.setColor(tangentColor);
canvas.add(tan, 0);
canvas.add(cross, 1);
subController.add(tan);
subController.add(cross);
if (showSecond) {
tan = new TangentLine(xInput, deriv);
cross = new Crosshair(xInput, deriv2);
tan.setColor(tangentColor2);
cross.setColor(tangentColor2);
canvas.add(tan, 1);
canvas.add(cross, 2);
subController.add(tan);
subController.add(cross);
}
functionName = getParameter("FunctionName", "f");
String yName = getParameter("YName","y");
Color textColor = getColorParam("TextColor",Color.black);
Color bgColor = getColorParam("TextBackground",Color.white);
DrawString str;
if ("yes".equalsIgnoreCase(getParameter("ShowGraphLabels","yes"))) {
str = new DrawString(yName + " = " + functionName + "(" + xVar.getName() + ")");
str.setColor(textColor);
str.setBackgroundColor(bgColor);
str.setFrameWidth(1);
canvas.add(str,0);
str = new DrawString(yName + " = " + functionName + " ' (" + xVar.getName() + ")");
str.setColor(textColor);
str.setBackgroundColor(bgColor);
str.setFrameWidth(1);
canvas.add(str,1);
if (showSecond) {
str = new DrawString(yName + " = " + functionName + " ' ' (" + xVar.getName() + ")");
str.setColor(textColor);
str.setBackgroundColor(bgColor);
str.setFrameWidth(1);
canvas.add(str,2);
}
}
if ("yes".equalsIgnoreCase(getParameter("ShowValues","yes"))) {
str = new DrawString(functionName + "(#) = #", DrawString.BOTTOM_LEFT, new Value[] { xInput, new ValueMath(func,xInput) });
str.setColor(textColor);
str.setBackgroundColor(bgColor);
str.setFrameWidth(1);
str.setNumSize(7);
canvas.add(str,0);
subController.add(str);
str = new DrawString(functionName + " ' (#) = #", DrawString.BOTTOM_LEFT, new Value[] { xInput, new ValueMath(deriv,xInput) });
str.setColor(textColor);
str.setBackgroundColor(bgColor);
str.setFrameWidth(1);
str.setNumSize(7);
canvas.add(str,1);
subController.add(str);
if (showSecond) {
str = new DrawString(functionName + " ' ' (#) = #", DrawString.BOTTOM_LEFT, new Value[] { xInput, new ValueMath(deriv2,xInput) });
str.setColor(textColor);
str.setBackgroundColor(bgColor);
str.setFrameWidth(1);
str.setNumSize(7);
canvas.add(str,2);
subController.add(str);
}
}
} // end setUpCanvas()
protected void addCanvasBorder() { // override to add the border to each coordinate rect, and make default width equal to 1
int borderWidth;
double[] bw = getNumericParam("BorderWidth");
if (bw == null || bw.length == 0 || bw[0] > 25)
borderWidth = 2;
else
borderWidth = (int)Math.round(bw[0]);
if (borderWidth > 0) {
canvas.add( new DrawBorder( getColorParam("BorderColor", Color.black), borderWidth ), 0 );
canvas.add( new DrawBorder( getColorParam("BorderColor", Color.black), borderWidth ), 1 );
if (deriv2 != null)
canvas.add( new DrawBorder( getColorParam("BorderColor", Color.black), borderWidth ), 2 );
}
}
protected void doLoadExample(String example) {
// This method is called when the user loads an example from the
// example menu (if there is one). It overrides an empty method
// in GenericGraphApplet.
// For the SecantTangent applet, the example string should contain
// an expression that defines the function to be graphed. This can optionally
// be followed by a semicoloon and a list of four or five numbers.
// The first four numbers give the x- and y-limits to be used for the
// example. If they are not present, then -5,5,-5,5 is used. The
// fifth number, if present, gives the x-coord where the tangent line
// is drawn initially.
int pos = example.indexOf(";");
double[] limits = { -5,5,-5,5 }; // x- and y-limits to use
if (pos > 0) { // get limits from example text
String limitsText = example.substring(pos+1);
example = example.substring(0,pos);
StringTokenizer toks = new StringTokenizer(limitsText, " ,");
if (toks.countTokens() >= 4) {
for (int i = 0; i < 4; i++) {
try {
Double d = new Double(toks.nextToken());
limits[i] = d.doubleValue();
}
catch (NumberFormatException e) {
}
}
if (toks.countTokens() > 0) { // Get point for tangent line
try {
Double d = new Double(toks.nextToken());
xInput.setVal( d.doubleValue() );
}
catch (NumberFormatException e) {
}
}
}
}
// Set up the example data and recompute everything.
if (functionInput != null) {
// If there is a function input box, put the example text in it.
functionInput.setText(example);
}
else {
// If there is no user input, set the function in the graph directly.
// Also, in this case, func is a "WrapperFunction". Set the
// definition of that WrapperFunction to be the same as f
try {
Expression exp = parser.parse(example);
derivExpression = exp.derivative(xVar);
Function f = new SimpleFunction( exp, xVar );
((WrapperFunction)func).setFunction(f);
}
catch (ParseError e) {
// There should't be parse error's in the Web-page
// author's examples! If there are, the function
// just won't change.
}
}
CoordinateRect coords = canvas.getCoordinateRect(0);
coords.setLimits(limits);
coords.setRestoreBuffer();
canvas.getCoordinateRect(1).setRestoreBuffer();
if (deriv2 != null)
canvas.getCoordinateRect(0).setRestoreBuffer();
mainController.compute();
} // end doLoadExample()
public static void main(String[] a){
javax.swing.JFrame f = new javax.swing.JFrame();
Applet app = new Derivatives();
app.init();
f.getContentPane().add (app);
f.pack();
f.setSize (new Dimension (500, 500));
f.setVisible(true);
}
} // end class SimpleGraph
 jcm1-source.zip( 532 k)
Related examples in the same category