Function Composition
/*************************************************************************
* *
* This source code file, and compiled classes derived from it, can *
* be used and distributed without restriction, including for commercial *
* use. (Attribution is not required but is appreciated.) *
* *
* David J. Eck *
* Department of Mathematics and Computer Science *
* Hobart and William Smith Colleges *
* Geneva, New York 14456, USA *
* Email: eck@hws.edu WWW: http://math.hws.edu/eck/ *
* *
*************************************************************************/
import java.awt.*;
import java.awt.event.*;
import java.util.StringTokenizer;
import java.applet.Applet;
import edu.hws.jcm.data.*;
import edu.hws.jcm.draw.*;
import edu.hws.jcm.awt.*;
import edu.hws.jcm.functions.*;
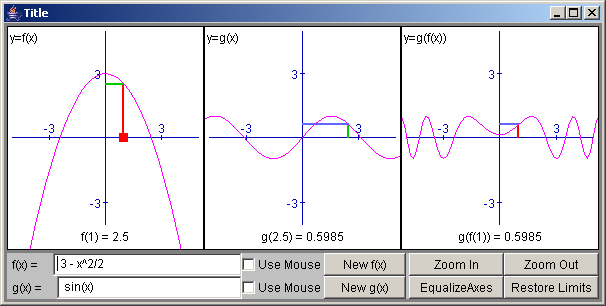
// A Function composation applet displays the graphs of two functions, f(x) and g(x), and their
// coposition, g(f(x)). It marks points (x,f(x)), (f(x),g(f(x)), and (x,g(f(x))) on the respective
// graphs. The user controls the value of x by dragging a red square along the x-axis of the first
// graph. The functions f and g can be given as table functions instead of expressions. The
// user controls this by clicking on check boxes. When a table function is displayed, the user
// can modify it by dragging its points. Optionally, the apple can also display tangent lines
// to the graphs. The slopes of the tangent line are supposed to illustrate the chain rule.
// Note: This inherits from GenericGraphApplet, but a lot of code in that applet is superceded
// here. In particular, there is no possibility of having a limit control panel.
public class FunctionComposition extends GenericGraphApplet implements ActionListener, ItemListener {
Button zoomInButton, zoomOutButton, restoreButton, equalizeButton; // Control buttons for
// setting limits on coordinate rects.
Button fComputeButton, gComputeButton; // Buttons that the user can press when she enters a new function.
// If the displayed function is a table function, the function's values
// are all reset to zero.
Variable pointX; // The x-coordinate that is marked on the graph of f(x)
// There are two possibilities for each function -- an expression or a table.
// I need variables for keeping track of both possibilities. They are swapped in
// and out when the user clicks on a check box. They can also be swapped when
// an example is loaded. The data for the functions:
Checkbox fCheck, gCheck; // checkboxes for switching between the two versions of the functions.
ExpressionInput fInput, gInput; // Input boxes for the definitions of f and g.
Function fFunc, gFunc; // The functions, defined by expressions.
Graph1D fGraph, gGraph; // The graphs of the functions defined by expressions
TableFunction fTable, gTable; // The functions, defined by tables.
TableFunctionGraph fTableGraph, gTableGraph; // The graphs of the functions defined by tables.
boolean fTableShown, gTableShown; // keep track of which version of the function is shown.
String fSaveText, gSaveText; // Save the text in the input box while a table shown is shown.
WrapperFunction fWrapper, gWrapper; // These functions refer to f and g, whichever versions of
// f and g are currently in effect. They are used to form
// the composition function, g(f(x)). So the composed function
// is valid however f and g are represented.
public void setUpMainPanel() { // Set up the applet.
// basic setup, with three coordinate rects in the canvas
mainController = new Controller();
defaultFrameSize = new int[] { 606, 306 };
Color textColor = getColorParam("TextColor", Color.black);
Color canvasBackground = getColorParam("CanvasColor", Color.white);
boolean useInputs = ! "no".equalsIgnoreCase(getParameter("UseFunctionInput", "yes"));
double[] gap = getNumericParam("Insets");
if (gap == null || gap.length == 0 || gap[0] < 0 || gap[0] > 50)
mainPanel.setInsetGap(3);
else
mainPanel.setInsetGap( (int)Math.round(gap[0]) );
parser = new Parser(null,0);
setUpParser();
setUpExampleMenu();
setUpTopPanel();
Color color;
color = getColorParam("BackgroundColor", Color.gray);
mainPanel.setBackground(color);
color = getColorParam("ForegroundColor", Color.black);
mainPanel.setForeground(color);
double[] limits = getNumericParam("Limits");
if (limits == null || limits.length < 4)
limits = new double[] { -5, 5, -5 ,5 };
canvas = new DisplayCanvas();
mainPanel.add(canvas,BorderLayout.CENTER); // add canvas to panel
canvas.setBackground(canvasBackground);
if ( ! "no".equalsIgnoreCase(getParameter("UseMouseZoom", "no")) )
canvas.setHandleMouseZooms(true);
if ( ! "no".equalsIgnoreCase(getParameter("UseOffscreenCanvas", "yes")) )
canvas.setUseOffscreenCanvas(true);
canvas.addCoordinateRect(new CoordinateRect(limits[0],limits[1],limits[2],limits[3]), 0, 1.0/3.0, 0, 1,null);
canvas.addCoordinateRect(new CoordinateRect(limits[0],limits[1],limits[2],limits[3]),1.0/3.0, 2.0/3.0, 0,1,null);
canvas.addCoordinateRect(new CoordinateRect(limits[0],limits[1],limits[2],limits[3]),2.0/3.0, 1, 0, 1, null);
if ( ! "no".equalsIgnoreCase(getParameter("UseGrid", "no")) ) {
color = getColorParam("GridColor");
Grid g = new Grid();
if (color != null)
g.setColor(color);
canvas.add(g,0);
g = new Grid();
if (color != null)
g.setColor(color);
canvas.add(g,1);
g = new Grid();
if (color != null)
g.setColor(color);
canvas.add(g,2);
}
canvas.add(makeAxes(), 0);
canvas.add(makeAxes(), 1);
canvas.add(makeAxes(), 2);
// Make the expression functions
fSaveText = getParameter("Function"," 3 - " + xVar.getName() + "^2/2");
gSaveText = getParameter("SecondFunction", " sin(" + xVar.getName() + ")");
if (useInputs) {
fInput = new ExpressionInput(fSaveText, parser);
gInput = new ExpressionInput(gSaveText, parser);
fFunc = fInput.getFunction(xVar);
gFunc = gInput.getFunction(xVar);
}
else {
fFunc = new SimpleFunction( parser.parse(fSaveText), xVar );
gFunc = new SimpleFunction( parser.parse(gSaveText), xVar );
}
fGraph = new Graph1D(fFunc);
gGraph = new Graph1D(gFunc);
// Create the wrapper functions for f and g and use it to make a compostion function
fWrapper = new WrapperFunction(fFunc);
fWrapper.setName("f");
gWrapper = new WrapperFunction(gFunc);
gWrapper.setName("g");
Parser p1 = new Parser(); // parser for making the composition function
p1.add(fWrapper);
p1.add(gWrapper);
ExpressionFunction comp = new ExpressionFunction("h", new String[] { "x" }, "g(f(" + xVar.getName() + "))", p1);
Graph1D compositionGraph = new Graph1D(comp);
fTableShown = gTableShown = false;
// Make table functions. If a table function is specified in applet params, but no
// expression is specified, show the table function.
String tf = getParameter("TableFunction");
if (tf != null) {
try {
fTable = parseTableFuncDef(tf);
}
catch (Exception e) {
tf = null;
}
}
if (tf == null) {
fTable = new TableFunction();
fTable.addIntervals(6, -5, 5);
}
fTableGraph = new TableFunctionGraph(fTable);
fTableGraph.setInteractive(true);
if (getParameter("Function") == null && tf != null) { // show table function at startup
fGraph.setVisible(false);
fTableShown = true;
fWrapper.setFunction(fTable);
if (fInput != null) {
fInput.setEnabled(false);
fInput.setThrowErrors(false);
fInput.setText("Drag points to modify function.");
}
}
else {
fTableGraph.setVisible(false);
}
tf = getParameter("SecondTableFunction");
if (tf != null) {
try {
gTable = parseTableFuncDef(tf);
}
catch (Exception e) {
tf = null;
}
}
if (tf == null) {
gTable = new TableFunction();
gTable.addIntervals(6, -5, 5);
}
gTableGraph = new TableFunctionGraph(gTable);
gTableGraph.setInteractive(true);
if (getParameter("SecondFunction") == null && tf != null) { // show table function at startup
gGraph.setVisible(false);
gTableShown = true;
gWrapper.setFunction(gTable);
if (gInput != null) {
gInput.setEnabled(false);
gInput.setThrowErrors(false);
gInput.setText("Drag points to modify function.");
}
}
else {
gTableGraph.setVisible(false);
}
// Create the stuff for marking points on each graph
DraggablePoint point = new DraggablePoint(DraggablePoint.SQUARE); // gives x-coord
Color pointColor1 = getColorParam("PointColor1", Color.red);
Color pointColor2 = getColorParam("PointColor2", new Color(0,200,0));
Color pointColor3 = getColorParam("PointColor3", new Color(100,100,255));
point.setColor(pointColor1);
point.clampY(0);
point.setLocation(1,0);
canvas.add(point,0);
pointX = point.getXVar();
Value fOfX = new ValueMath(fWrapper, pointX);
Value gOfFOfX = new ValueMath(gWrapper, fOfX);
DrawGeometric line1;
line1 = new DrawGeometric( DrawGeometric.LINE_ABSOLUTE, pointX, new Constant(0), pointX, fOfX );
line1.setColor(pointColor1);
canvas.add(line1, 0);
DrawGeometric line2;
line2 = new DrawGeometric( DrawGeometric.LINE_ABSOLUTE, pointX, fOfX, new Constant(0), fOfX );
line2.setColor(pointColor2);
canvas.add(line2, 0);
DrawGeometric line3;
line3 = new DrawGeometric( DrawGeometric.LINE_ABSOLUTE, fOfX, new Constant(0), fOfX, gOfFOfX );
line3.setColor(pointColor2);
canvas.add(line3, 1);
DrawGeometric line4;
line4 = new DrawGeometric( DrawGeometric.LINE_ABSOLUTE, fOfX, gOfFOfX, new Constant(0), gOfFOfX );
line4.setColor(pointColor3);
canvas.add(line4, 1);
DrawGeometric line5;
line5 = new DrawGeometric( DrawGeometric.LINE_ABSOLUTE, pointX, new Constant(0), pointX, gOfFOfX );
line5.setColor(pointColor1);
canvas.add(line5, 2);
DrawGeometric line6;
line6 = new DrawGeometric( DrawGeometric.LINE_ABSOLUTE, pointX, gOfFOfX, new Constant(0), gOfFOfX );
line6.setColor(pointColor3);
canvas.add(line6, 2);
line1.setLineWidth(2);
line2.setLineWidth(2);
line3.setLineWidth(2);
line4.setLineWidth(2);
line5.setLineWidth(2);
line6.setLineWidth(2);
// Add the graphs
Color gc = getColorParam("GraphColor", Color.magenta);
fGraph.setColor(gc);
gGraph.setColor(gc);
fTableGraph.setColor(gc);
gTableGraph.setColor(gc);
compositionGraph.setColor(gc);
canvas.add(fGraph, 0);
canvas.add(fTableGraph, 0);
canvas.add(gGraph, 1);
canvas.add(gTableGraph, 1);
canvas.add(compositionGraph, 2);
// Create tangent lines, if they are called for by an applet param
TangentLine tangent1=null, tangent2=null, tangent3=null;
DrawString ts1=null, ts2=null, ts3=null;
if (! "no".equalsIgnoreCase(getParameter("ShowTangents","no"))) {
Color tangentColor = getColorParam("TangentColor", Color.gray);
tangent1 = new TangentLine(pointX,fWrapper);
tangent1.setColor(tangentColor);
canvas.add(tangent1,0);
tangent2 = new TangentLine(fOfX,gWrapper);
tangent2.setColor(tangentColor);
canvas.add(tangent2,1);
tangent3 = new TangentLine(pointX,comp);
tangent3.setColor(tangentColor);
canvas.add(tangent3,2);
if ("yes".equalsIgnoreCase(getParameter("ShowSlopes","yes"))) {
ts1 = new DrawString("slope = #", DrawString.TOP_RIGHT,
new Value[] { new ValueMath(fWrapper.derivative(1), pointX) });
ts1.setColor(textColor);
ts1.setNumSize(6);
canvas.add(ts1,0);
ts2 = new DrawString("slope = #", DrawString.TOP_RIGHT,
new Value[] { new ValueMath(gWrapper.derivative(1), fOfX) });
ts2.setColor(textColor);
ts2.setNumSize(6);
canvas.add(ts2,1);
ts3 = new DrawString("slope = #", DrawString.TOP_RIGHT,
new Value[] { new ValueMath(comp.derivative(1), pointX) });
ts3.setColor(textColor);
ts3.setNumSize(6);
canvas.add(ts3,2);
}
}
// Create DrawStrings for displaying information over the graphs.
if ("yes".equalsIgnoreCase(getParameter("ShowFunctionNames","yes"))) {
DrawString d = new DrawString("y=f(" + xVar.getName() + ")");
d.setColor(textColor);
canvas.add(d, 0);
d = new DrawString("y=g(" + xVar.getName() + ")");
d.setColor(textColor);
canvas.add(d, 1);
d = new DrawString("y=g(f(" + xVar.getName() + "))");
d.setColor(textColor);
canvas.add(d, 2);
}
DrawString ds1=null, ds2=null, ds3=null;
if ("yes".equalsIgnoreCase(getParameter("ShowCoordinates","yes"))) {
ds1 = new DrawString("f(#) = #", DrawString.BOTTOM_CENTER, new Value[] { pointX, fOfX });
ds1.setNumSize(6);
ds1.setColor(textColor);
ds1.setBackgroundColor(canvasBackground);
canvas.add(ds1, 0);
ds2 = new DrawString("g(#) = #", DrawString.BOTTOM_CENTER, new Value[] { fOfX, gOfFOfX });
ds2.setNumSize(6);
ds2.setColor(textColor);
ds2.setBackgroundColor(canvasBackground);
canvas.add(ds2, 1);
ds3 = new DrawString("g(f(#)) = #", DrawString.BOTTOM_CENTER, new Value[] { pointX, gOfFOfX });
ds3.setNumSize(6);
ds3.setColor(textColor);
ds3.setBackgroundColor(canvasBackground);
canvas.add(ds3, 2);
}
// Add panner and borders
if (! "no".equalsIgnoreCase(getParameter("UsePanner", "no")) ) {
canvas.add(new Panner(), 0);
canvas.add(new Panner(), 1);
canvas.add(new Panner(), 2);
}
int borderWidth;
double[] bw = getNumericParam("BorderWidth");
if (bw == null || bw.length == 0 || bw[0] > 25)
borderWidth = 1;
else
borderWidth = (int)Math.round(bw[0]);
if (borderWidth > 0) {
Color bc = getColorParam("BorderColor", Color.black);
canvas.add(new DrawBorder(bc, borderWidth), 0);
canvas.add(new DrawBorder(bc, borderWidth), 1);
canvas.add(new DrawBorder(bc, borderWidth), 2);
}
// Set up the bottom panel to hold inputs and control buttons, unless an
// applet param has specified that no input panel is desired.
if ( useInputs ) {
Panel bottom = new Panel();
bottom.setLayout(new BorderLayout(3,3));
bottom.setBackground(getColorParam("PanelBackground", Color.lightGray));
mainPanel.add(bottom,BorderLayout.SOUTH);
Panel left = new Panel();
left.setLayout(new GridLayout(0,1));
bottom.add(left, BorderLayout.CENTER);
Panel right = new Panel();
right.setLayout(new GridLayout(0,2));
bottom.add(right, BorderLayout.EAST);
Panel fPanel = new Panel();
fPanel.setLayout(new BorderLayout());
fPanel.add(new Label(" f(" + xVar.getName() + ") = "), BorderLayout.WEST);
fPanel.add(fInput, BorderLayout.CENTER);
Panel fp = new Panel();
fp.setLayout(new GridLayout(1,2));
fCheck = new Checkbox("Use Mouse");
if (fTableShown)
fCheck.setState(true);
fCheck.addItemListener(this);
fp.add(fCheck);
fComputeButton = new Button("New f(" + xVar.getName() + ")");
fComputeButton.addActionListener(this);
fp.add(fComputeButton);
fPanel.add(fp,BorderLayout.EAST);
left.add(fPanel);
Panel gPanel = new Panel();
gPanel.setLayout(new BorderLayout());
gPanel.add(new Label(" g(" + xVar.getName() + ") = "), BorderLayout.WEST);
gPanel.add(gInput, BorderLayout.CENTER);
Panel gp = new Panel();
gp.setLayout(new GridLayout(1,2));
gCheck = new Checkbox("Use Mouse");
if (gTableShown)
gCheck.setState(true);
gCheck.addItemListener(this);
gp.add(gCheck);
gComputeButton = new Button("New g(" + xVar.getName() + ")");
gComputeButton.addActionListener(this);
gp.add(gComputeButton);
gPanel.add(gp,BorderLayout.EAST);
left.add(gPanel);
zoomInButton = new Button("Zoom In");
right.add(zoomInButton);
zoomInButton.addActionListener(this);
zoomOutButton = new Button("Zoom Out");
right.add(zoomOutButton);
zoomOutButton.addActionListener(this);
equalizeButton = new Button("EqualizeAxes");
equalizeButton.addActionListener(this);
right.add(equalizeButton);
restoreButton = new Button("Restore Limits");
right.add(restoreButton);
restoreButton.addActionListener(this);
fInput.setOnUserAction(mainController);
gInput.setOnUserAction(mainController);
mainController.add(fInput);
mainController.add(gInput);
}
// finish setting up controllers
fTableGraph.setOnDrag(mainController);
gTableGraph.setOnDrag(mainController);
mainController.add(canvas);
mainController.setErrorReporter(canvas);
Controller lineController = new Controller(); // doesn't recompute the graphs
mainController.add(lineController);
point.setOnUserAction(lineController);
lineController.add(point);
lineController.add(line1);
lineController.add(line2);
lineController.add(line3);
lineController.add(line4);
lineController.add(line5);
lineController.add(line6);
if (ds1 != null) {
lineController.add(ds1);
lineController.add(ds2);
lineController.add(ds3);
}
if (tangent1 != null) {
lineController.add(tangent1);
lineController.add(tangent2);
lineController.add(tangent3);
}
if (ts1 != null) {
lineController.add(ts1);
lineController.add(ts2);
lineController.add(ts3);
}
} // end makeMainPanel()
public void itemStateChanged(ItemEvent evt) {
// Respond when user clicks one of the check boxes.
Object src = evt.getSource();
if (src == fCheck) { // Swap the f table function in or out
boolean check = fCheck.getState();
if (check == fTableShown)
return;
fTableShown = check;
fGraph.setVisible(!fTableShown);
fTableGraph.setVisible(fTableShown);
if (fTableShown) {
fWrapper.setFunction(fTable);
fSaveText = fInput.getText();
fInput.setText("Drag points to modify function.");
fInput.setThrowErrors(false);
fInput.setEnabled(false);
}
else {
fWrapper.setFunction(fFunc);
fInput.setText(fSaveText);
fInput.setThrowErrors(true);
fInput.setEnabled(true);
}
mainController.compute();
}
else if (src == gCheck) { // Swap the g table function in or out
boolean check = gCheck.getState();
if (check == gTableShown)
return;
gTableShown = check;
gGraph.setVisible(!gTableShown);
gTableGraph.setVisible(gTableShown);
if (gTableShown) {
gWrapper.setFunction(gTable);
gSaveText = gInput.getText();
gInput.setText("Drag points to modify function.");
gInput.setThrowErrors(false);
gInput.setEnabled(false);
}
else {
gWrapper.setFunction(gFunc);
gInput.setText(gSaveText);
gInput.setThrowErrors(true);
gInput.setEnabled(true);
}
mainController.compute();
}
} // end itemStateChanged()
public void actionPerformed(ActionEvent evt) {
// respond when the user clicks one of the control buttons.
Object src = evt.getSource();
if (src == zoomInButton) {
canvas.getCoordinateRect(0).zoomIn();
canvas.getCoordinateRect(1).zoomIn();
canvas.getCoordinateRect(2).zoomIn();
}
else if (src == zoomOutButton) {
canvas.getCoordinateRect(0).zoomOut();
canvas.getCoordinateRect(1).zoomOut();
canvas.getCoordinateRect(2).zoomOut();
}
else if (src == restoreButton) {
canvas.getCoordinateRect(0).restore();
canvas.getCoordinateRect(1).restore();
canvas.getCoordinateRect(2).restore();
}
else if (src == equalizeButton) {
canvas.getCoordinateRect(0).equalizeAxes();
canvas.getCoordinateRect(1).equalizeAxes();
canvas.getCoordinateRect(2).equalizeAxes();
}
else if (src == fComputeButton) {
if (fTableShown) {
int ct = fTable.getPointCount();
double val;
if (0 < canvas.getCoordinateRect(0).getYmin() || 0 > canvas.getCoordinateRect(0).getYmax())
val = canvas.getCoordinateRect(0).getYmin();
else
val = 0;
for (int i = 0; i < ct; i++)
fTable.setY(i,val);
}
mainController.compute();
}
else if (src == gComputeButton) {
if (gTableShown) {
int ct = gTable.getPointCount();
double val;
if (0 < canvas.getCoordinateRect(1).getYmin() || 0 > canvas.getCoordinateRect(1).getYmax())
val = canvas.getCoordinateRect(1).getYmin();
else
val = 0;
for (int i = 0; i < ct; i++)
gTable.setY(i,val);
}
mainController.compute();
}
else {
super.actionPerformed(evt);
}
} // end actionPerformed()
protected void doLoadExample(String example) {
// This method is called when the user loads an example from the
// example menu (if there is one). It overrides an empty method
// in GenericGraphApplet.
// The example string should contain two function definitions,
// separated by a semicolon. A function definition can be either
// an expression or a table function. These espressions can be
// followed by a semicolon and four or five numberd.
// The first four numbers give the x- and y-limits to be used for the
// example. If they are not present, then -5,5,-5,5 is used. The
// next number is used as the x-coordinated that is selected on
// the graph of the first function.
int pos = example.indexOf(";");
if (pos == -1) {
System.out.println("Illegal example -- must have two functions");
return;
}
String example2 = example.substring(pos+1);
example = example.substring(0,pos).trim();
pos = example2.indexOf(";");
double[] limits = { -5,5,-5,5 }; // x- and y-limits to use
if (pos > 0) {
// Get limits from example2 text.
String nums = example2.substring(pos+1);
example2 = example2.substring(0,pos).trim();
StringTokenizer toks = new StringTokenizer(nums, " ,");
if (toks.countTokens() >= 4) {
for (int i = 0; i < 4; i++) {
try {
Double d = new Double(toks.nextToken());
limits[i] = d.doubleValue();
}
catch (NumberFormatException e) {
}
}
}
if (toks.hasMoreTokens()) {
// get the x coordinate
try {
double d = (new Double(toks.nextToken())).doubleValue();
pointX.setVal(d);
}
catch (NumberFormatException e) {
}
}
}
// Set up the example data and recompute everything.
if (example.startsWith("table")) { // install table for f(x) from example
try {
TableFunction tf = parseTableFuncDef(example);
fTable = tf;
fTableGraph.setFunction(tf);
fWrapper.setFunction(tf);
if (!fTableShown) { // show table function
if (fCheck != null)
fCheck.setState(true);
fGraph.setVisible(false);
fTableGraph.setVisible(true);
fTableShown = true;
if (fInput != null) {
fSaveText = fInput.getText();
fInput.setText("Drag points to modify function.");
fInput.setThrowErrors(false);
fInput.setEnabled(false);
}
}
}
catch (ParseError e) {
System.out.println("Illegal table function for f(x) in example.");
}
}
else { // install expression function for f(x)
try {
if (fInput != null)
fInput.setText(example);
else {
Function f = new SimpleFunction( parser.parse(example), xVar );
fFunc = f;
fGraph.setFunction(f);
fWrapper.setFunction(f);
}
if (fTableShown) { // show expression function
if (fCheck != null)
fCheck.setState(false);
fGraph.setVisible(true);
fTableGraph.setVisible(false);
fTableShown = false;
if (fInput != null) {
fInput.setThrowErrors(true);
fInput.setEnabled(true);
}
}
}
catch (ParseError e) {
System.out.println("Parse error for f(x) in example.");
}
}
if (example2.startsWith("table")) { // install table for fg(x) from example
try {
TableFunction tg = parseTableFuncDef(example2);
gTable = tg;
gTableGraph.setFunction(tg);
gWrapper.setFunction(tg);
if (!gTableShown) { // show table function
if (gCheck != null)
gCheck.setState(true);
gGraph.setVisible(false);
gTableGraph.setVisible(true);
gTableShown = true;
if (gInput != null) {
gSaveText = gInput.getText();
gInput.setText("Drag points to modify function.");
gInput.setThrowErrors(false);
gInput.setEnabled(false);
}
}
}
catch (ParseError e) {
System.out.println("Illegal table function for g(x) in example.");
}
}
else { // install expression function for g(x)
try {
if (gInput != null)
gInput.setText(example2);
else {
Function g = new SimpleFunction( parser.parse(example2), xVar );
gFunc = g;
gGraph.setFunction(g);
gWrapper.setFunction(g);
}
if (gTableShown) { // show expression function
if (gCheck != null)
gCheck.setState(false);
gGraph.setVisible(true);
gTableGraph.setVisible(false);
gTableShown = false;
if (gInput != null) {
gInput.setThrowErrors(true);
gInput.setEnabled(true);
}
}
}
catch (ParseError e) {
System.out.println("Parse error for g(x) in example.");
}
}
CoordinateRect coords = canvas.getCoordinateRect(0);
coords.setLimits(limits);
coords.setRestoreBuffer();
coords = canvas.getCoordinateRect(1);
coords.setLimits(limits);
coords.setRestoreBuffer();
coords = canvas.getCoordinateRect(2);
coords.setLimits(limits);
coords.setRestoreBuffer();
mainController.compute();
} // end doLoadExample()
public static void main(String[] a){
javax.swing.JFrame f = new javax.swing.JFrame();
Applet app = new FunctionComposition();
app.init();
f.getContentPane().add (app);
f.pack();
f.setSize (new Dimension (500, 500));
f.setVisible(true);
}
} // end class FunctionComposition
 jcm1-source.zip( 532 k)
Related examples in the same category