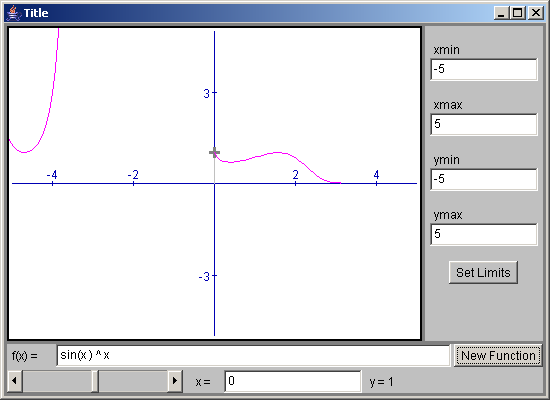
Display the graph of a single function of one variable
/*************************************************************************
*                                                                        *
*  This source code file, and compiled classes derived from it, can      *
*  be used and distributed without restriction, including for commercial *
*  use.  (Attribution is not required but is appreciated.)               *
*                                                                        *
*   David J. Eck                                                         *
*   Department of Mathematics and Computer Science                       *
*   Hobart and William Smith Colleges                                    *
*   Geneva, New York 14456,   USA                                        *
*   Email: eck@hws.edu          WWW: http://math.hws.edu/eck/            *
*                                                                        *
*************************************************************************/


// The SimpleGraph applet is a configurable applet that displays the graph of
// a single function of one variable.  Optionally, a point can be marked on
// the graph.  The user can control the location of the point.

import java.awt.*;
import java.applet.Applet;
import java.util.StringTokenizer;
import edu.hws.jcm.draw.*;
import edu.hws.jcm.data.*;
import edu.hws.jcm.functions.*;
import edu.hws.jcm.awt.*;


public class SimpleGraph extends GenericGraphApplet {

   // Declare some private variables that are created in one method in
   // this class and used in a second method.

   private VariableInput xInput; // Contains the x-coordinate of the marked point.

   private Function func;   // The function that is graphed.
   private Graph1D graph;   // The graph of the function.

   private DrawGeometric point;  // An oval that marks the selected point on the graph.
   private DrawGeometric vLine;  // A line from the point to the x-axis.
   private DrawGeometric hLine;  // A line from the point to the y-axis.


   protected void setUpCanvas() {  // Override this to add more stuff to the canvas.

      super.setUpCanvas();  // Do the common setup: Add the axes and

      // When setUpCanvas is called, the functionInput already exists, if one is
      // to be used, since it is created in setUpBopttomPanel(), which is called
      // before setUpCanvas.  If functionInput exists, add a graph of the function
      // from functionInput to the canvas.  If not, create a graph of the function
      // specified by the parameter named "Function".

      if (functionInput != null)
         func = functionInput.getFunction(xVar);
      else {
         String def = getParameter("Function", " abs(" + xVar.getName() + ") ^ " + xVar.getName());
         Function f = new SimpleFunction( parser.parse(def), xVar );
         func = new WrapperFunction(f);
      }
      graph = new Graph1D(func);
      Color color = getColorParam("GraphColor");
      if (color != null)
         graph.setColor(color);

      // If the applet is configured to mark a point on the graph, create the point and
      // the lines from the point to the x- and y-axes and add them to the canvas before
      // the graph.  The properties of these objects have to be set later, in setUpMainPanel(),
      // because the input objects that they depend on don't exist when this method is
      // called.  However, I want to add them to the canvas here so they will lie behind the
      // graph and behind the border of the canvas (which is added after setUpCanvas() is
      // executed).

      if (! "no".equalsIgnoreCase( getParameter("ShowPoint","yes") ) ) {
         vLine = new DrawGeometric();
         hLine = new DrawGeometric();
         point = new DrawGeometric();
         canvas.add(vLine);
         canvas.add(hLine);
         canvas.add(point);
      }

      canvas.add(graph);  // Finally, add the graph to the canvas.

   } // end setUpCanvas()


   protected void setUpMainPanel() { // Override to handle the point marked on the graph

      super.setUpMainPanel(); // Do the common setup

      if ( "no".equalsIgnoreCase( getParameter("ShowPoint","yes") ) ) {
         return;  // If the applet is not configured to show a point, there is nothing to do.
      }

      // Create two input objects, a VariableInput and a VariableSlider.  The values of
      // the two inputs will be synchronized with each other using a "Tie".  The
      // minimum and maximum values represented on the slider are given by the
      // the minimum and maximum x-coordinates on the CoordinateRect.  This will restrict
      // the x-coodinate of the point that is marked on the graph to the range of
      // x-values actually shown on the screen.

      xInput = new VariableInput();   // An input box for the x-coord of the marked point
      xInput.setInputStyle(VariableInput.REAL);   // Allow only real numbers (not constant expressions)
      CoordinateRect coords = canvas.getCoordinateRect();
      VariableSlider xSlider = new VariableSlider( coords.getValueObject(CoordinateRect.XMIN),
                                                      coords.getValueObject(CoordinateRect.XMAX) );

      Value yValue = new ValueMath(func,xSlider); // Represents the y-value of the marked point.

      DisplayLabel yDisplay = new DisplayLabel(" y = #", yValue);  // Shows the y-value of the point

      // Create a panel to contain the input objects.

      JCMPanel panel = new JCMPanel(1,3);
      panel.setBackground(getColorParam("PanelBackground",Color.lightGray));
      JCMPanel subpanel = new JCMPanel();
      String varName = getParameter("Variable","x");
      subpanel.add(new Label(" " + varName + " = ", Label.CENTER), BorderLayout.WEST);
      subpanel.add(xInput, BorderLayout.CENTER);
      panel.add(xSlider);
      panel.add(subpanel);
      panel.add(yDisplay);

      // If there is a functionInput box, then the SOUTH position of the mainPanel already contains
      // the inputPanel that contains that box.  If so, add the new panel to the SOUTH position of
      // the inputPanel.  (This is a good place, in general, to put extra input objects.)
      // If there is no inputPanel, then the SOUTH position of the mainPanel is empty, so put
      // the newly created panel there.  Also, set the background color for the input panel from
      // from the PanelBackground applet param.  (This is already done for inputPanel, if it exists.)

      if (inputPanel == null)
         mainPanel.add(panel, BorderLayout.SOUTH);
      else {
         inputPanel.setBackground(getColorParam("PanelBackground",Color.lightGray));
         inputPanel.add(panel, BorderLayout.SOUTH);
      }

      // Set up all the data for the point and the lines from the point to the axes.
      // The objects where created in setUpCanvas() and added to the canvas.

      hLine.setPoints(new Constant(0),yValue,xSlider,yValue);
      hLine.setPoints(new Constant(0),yValue,xSlider,yValue);
      point.setShape(DrawGeometric.CROSS);
      point.setPoints(xSlider,yValue,5,5);
      point.setLineWidth(3);
      vLine.setPoints(xSlider,new Constant(0),xSlider,yValue);
      Color c = getColorParam("LineColor", Color.lightGray);
      vLine.setColor(c);
      hLine.setColor(c);
      c = getColorParam("DotColor", Color.gray);
      point.setColor(c);

      // Now, I have to set a Controller to respond to changes in the input objects.
      // I could just use the mainController, but then the data for the graph would
      // be recomputed whenever the user changes the x-coordinate of the marked point.
      // For effieciency, I will use a separate Controller that only recomputes the
      // data for the point (not the graph) when the inputs change.

      Controller cc = new Controller();

      xInput.setOnTextChange(cc);   // cc responds when user types in the input box
      xSlider.setOnUserAction(cc);  // cc responds when the user drags the slider
      coords.setOnChange(cc);       // cc responds when the coordinate limits change;
                                    //    this is necessary because the minimum and
                                    //    maximum values on the slider have to be checked.

      cc.add( xInput );  // Check whether the values have changed.
      cc.add( xSlider );

      cc.add( new Tie(xSlider,xInput) );  // synchronize values of input box and slider

      cc.add( hLine );  // Recompute the values for the point and lines.
      cc.add( vLine );
      cc.add( point );

      cc.add( yDisplay ); // Recompute the value displayed on the yDisplay label.

      mainController.add(cc);  // When the mainController recomputes (because function has
                               //   been changed, all the stuff controlled by cc also has
                               //   to be checked.

      mainController.remove(canvas);  // The mainController should not recompute the contents
                                      //   of the canvas (which it would do by default).
      mainController.add(graph);      // But the mainController should recompute the graph.

   } // end setUpMainPanel()


   protected void doLoadExample(String example) {
         // This method is called when the user loads an example from the
         // example menu (if there is one).  It overrides an empty method
         // in GenericGraphApplet.
         //   For the SimpleGraph applet, the example string should contain
         // an expression that defines the function to be graphed.  This can optionally
         // be followed by a semicoloon and a list of four or five numbers.
         // The first four numbers give the x- and y-limits to be used for the
         // example.  If they are not present, then -5,5,-5,5 is used.  The
         // fifth number, if present, gives the x-coord of the marked point
         // on the graph.

      int pos = example.indexOf(";");

      double[] limits = { -5,5,-5,5 };  // x- and y-limits to use

      if (pos > 0) { // get limits from example text
         String limitsText = example.substring(pos+1);
         example = example.substring(0,pos);
         StringTokenizer toks = new StringTokenizer(limitsText, " ,");
         if (toks.countTokens() >= 4) {
            for (int i = 0; i < 4; i++) {
               try {
                   Double d = new Double(toks.nextToken());
                   limits[i] = d.doubleValue();
               }
               catch (NumberFormatException e) {
               }
            }
            if (toks.countTokens() > 0 && xInput != null) {
                  // get x-coord of marked point from example text
               try {
                   Double d = new Double(toks.nextToken());
                   xInput.setVal( d.doubleValue() );
               }
               catch (NumberFormatException e) {
               }
            }
         }
      }

      // Set up the example data and recompute everything.

      if (functionInput != null) {
            // If there is a function input box, put the example text in it.
         functionInput.setText(example);
      }
      else {
           // If there is no user input, set the function in the graph directly.
           // Also, in this case, func is a "WrapperFunction".  Set the
           // definition of that WrapperFunction to be the same as f
         try {
            Function f = new SimpleFunction( parser.parse(example), xVar );
            ((WrapperFunction)func).setFunction(f);
         }
         catch (ParseError e) {
             // There should't be parse error's in the Web-page
             // author's examples!  If there are, the function
             // just won't change.
         }
      }
      CoordinateRect coords = canvas.getCoordinateRect(0);
      coords.setLimits(limits);
      coords.setRestoreBuffer();
      mainController.compute();

   } // end doLoadExample()
      public static void main(String[] a){
         javax.swing.JFrame f = new javax.swing.JFrame();
         java.applet.Applet app = new SimpleGraph();
         app.init();

         f.getContentPane().add (app);

         f.pack();
         f.setSize (new Dimension (500, 500));
         f.setVisible(true);
      }


} // end class SimpleGraph
 jcm1-source.zip( 532 k)
Related examples in the same category