| Home | ||||||||||||||||||||
| Flex | ||||||||||||||||||||
|
| Flex » Chart | Screenshots |
| Image index for Chart : 1 2 3 4 5 6 7 8 9 10 11 12 13 14 15 16 17 18 19 20 21 22 23 24 25 26 27 28 29 30 |
| Combine column chart and pie chart Click image to read the source code. |
 |
| A bar chart with a vertical axis Click image to read the source code. |
 |
| Remove grid lines entirely Click image to read the source code. |
 |
| horizontal LineChart Click image to read the source code. |
 |
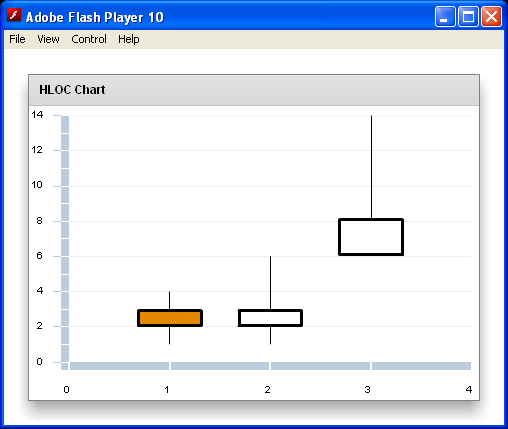
| CandlestickChart Click image to read the source code. |
 |
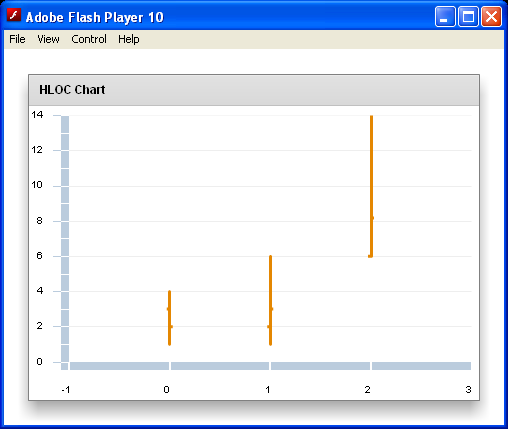
| HLOCChart Demo Click image to read the source code. |
 |
| Define the properties of the high-low lines and candlestick borders by using a Stroke class Click image to read the source code. |
 |
| Candlestick chart displaying stock prices Click image to read the source code. |
 |