| Home | ||||||||||||||||||||
| Flex | ||||||||||||||||||||
|
| Flex » Chart | Screenshots |
| Image index for Chart : 1 2 3 4 5 6 7 8 9 10 11 12 13 14 15 16 17 18 19 20 21 22 23 24 25 26 27 28 29 30 |
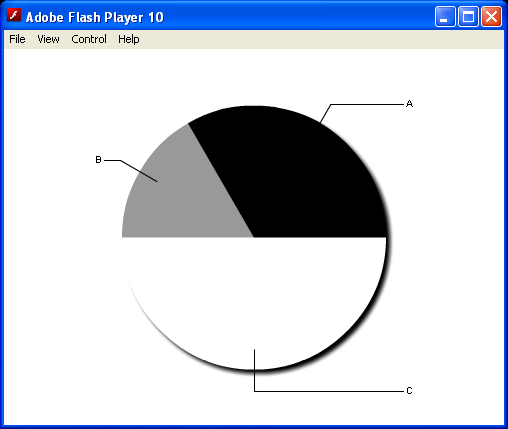
| Pie Set Fill Colors Click image to read the source code. |
 |
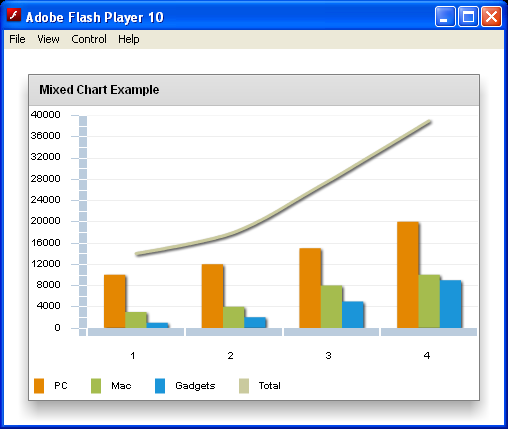
| Mixed Chart Click image to read the source code. |
 |
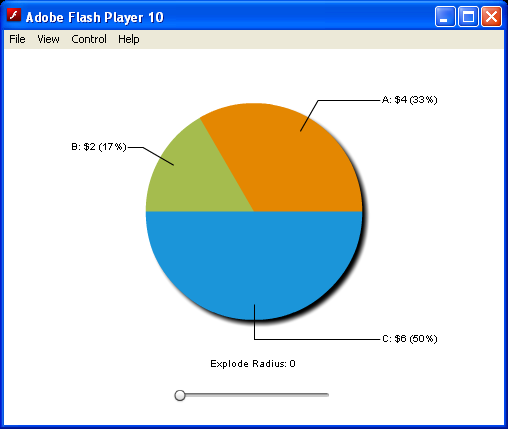
| Pie Explode Click image to read the source code. |
 |
| The following example defines the range of the y-axis: Click image to read the source code. |
 |
| Use chart items in more than one series Click image to read the source code. |
 |
| Define two colors and then uses those colors in the axis renderers and in the strokes and fills for the chart items Click image to read the source code. |
 |
| About the LinearAxis subclass Click image to read the source code. |
 |
| Legend with a border and title bar Click image to read the source code. |
 |