| Home | ||||||||||||||||||||
| Flex | ||||||||||||||||||||
|
| Flex » Chart | Screenshots |
| Image index for Chart : 1 2 3 4 5 6 7 8 9 10 11 12 13 14 15 16 17 18 19 20 21 22 23 24 25 26 27 28 29 30 |
| Name data series by using the displayName property of the series: Click image to read the source code. |
 |
| Turns on grid lines in both directions and applies them to the chart: Click image to read the source code. |
 |
| CSS for BarSeries and ColumnSeries Click image to read the source code. |
 |
| Showing multiple DataTips Click image to read the source code. |
 |
| Column Chart Item click Event Click image to read the source code. |
 |
| Use the fill property to set the color for each ColumnSeries object in a ColumnChart control Click image to read the source code. |
 |
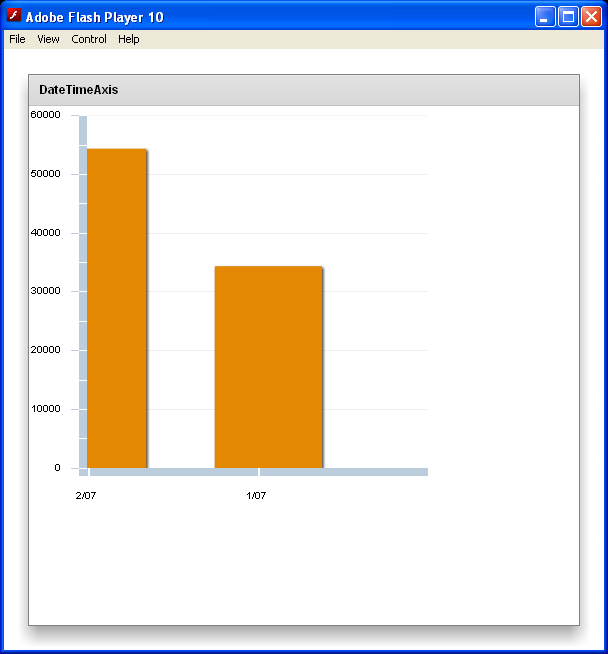
| Date Time Axis Range Click image to read the source code. |
 |
| To enable DataTips, set the value of the chart control's showDataTips property to true Click image to read the source code. |
 |