| Home | ||||||||||||||||||||
| Flex | ||||||||||||||||||||
|
| Flex » Chart | Screenshots |
| Image index for Chart : 1 2 3 4 5 6 7 8 9 10 11 12 13 14 15 16 17 18 19 20 21 22 23 24 25 26 27 28 29 30 |
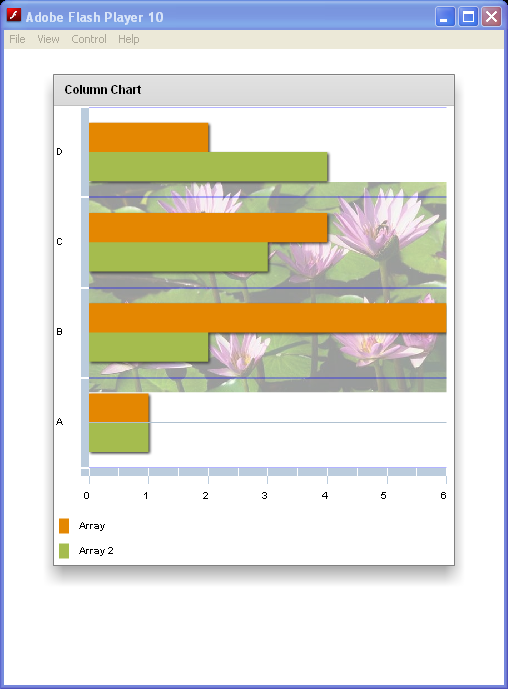
| Add an image to the chart and manipulate its propertiess Click image to read the source code. |
 |
| BarChart Click image to read the source code. |
 |
| Use gif graphic to represent each data point on the plot chart Click image to read the source code. |
 |
| Use the graphic file to represent data points on a PlotChart control Click image to read the source code. |
 |
| Add new grid lines as annotation elements to the chart and an image as the background element. Click image to read the source code. |
 |
| Add new grid lines as annotation elements to the chart and an image as the background element Click image to read the source code. |
|
| To explode all wedges of a pie chart evenly, you use the explodeRadius property on the PieSeries Click image to read the source code. |
 |
| Display data points in each series that are currently selected Click image to read the source code. |
 |