| Home | ||||||||||||||||||||
| Flex | ||||||||||||||||||||
|
| Flex » Chart | Screenshots |
| Image index for Chart : 1 2 3 4 5 6 7 8 9 10 11 12 13 14 15 16 17 18 19 20 21 22 23 24 25 26 27 28 29 30 |
| Define an area chart in which each series in the chart uses a solid fill with the same level of transparency: Click image to read the source code. |
 |
| extract the data from the HTML page by using regular expressions. Click image to read the source code. |
 |
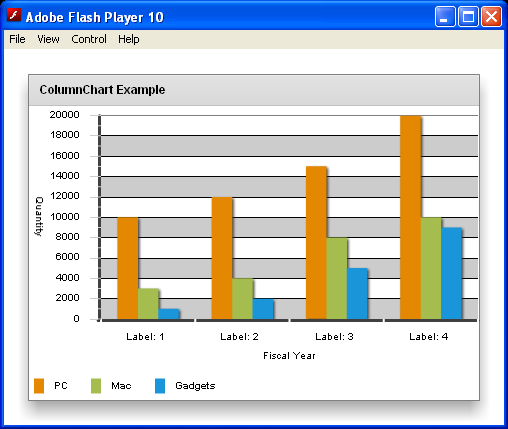
| Create a ColumnChart control with the default axis locations (bottom and left). Click image to read the source code. |
 |
| Randomly generating chart data Click image to read the source code. |
 |
| horizontal Axis Renderer for ColumnChart Click image to read the source code. |
 |
| Axis Renderer for ColumnChart Click image to read the source code. |
 |
| vertical Axis Renderer for ColumnChart Click image to read the source code. |
 |
| Column Chart Axis Label Click image to read the source code. |
 |